Golden Cross Trading Strategy: Strengths, Weaknesses, and Trading Examples
The golden cross trading strategy is a popular technical analysis tool used by traders to identify a bullish market trend. It is a chart pattern that occurs when a short-term moving average crosses above a long-term moving average.
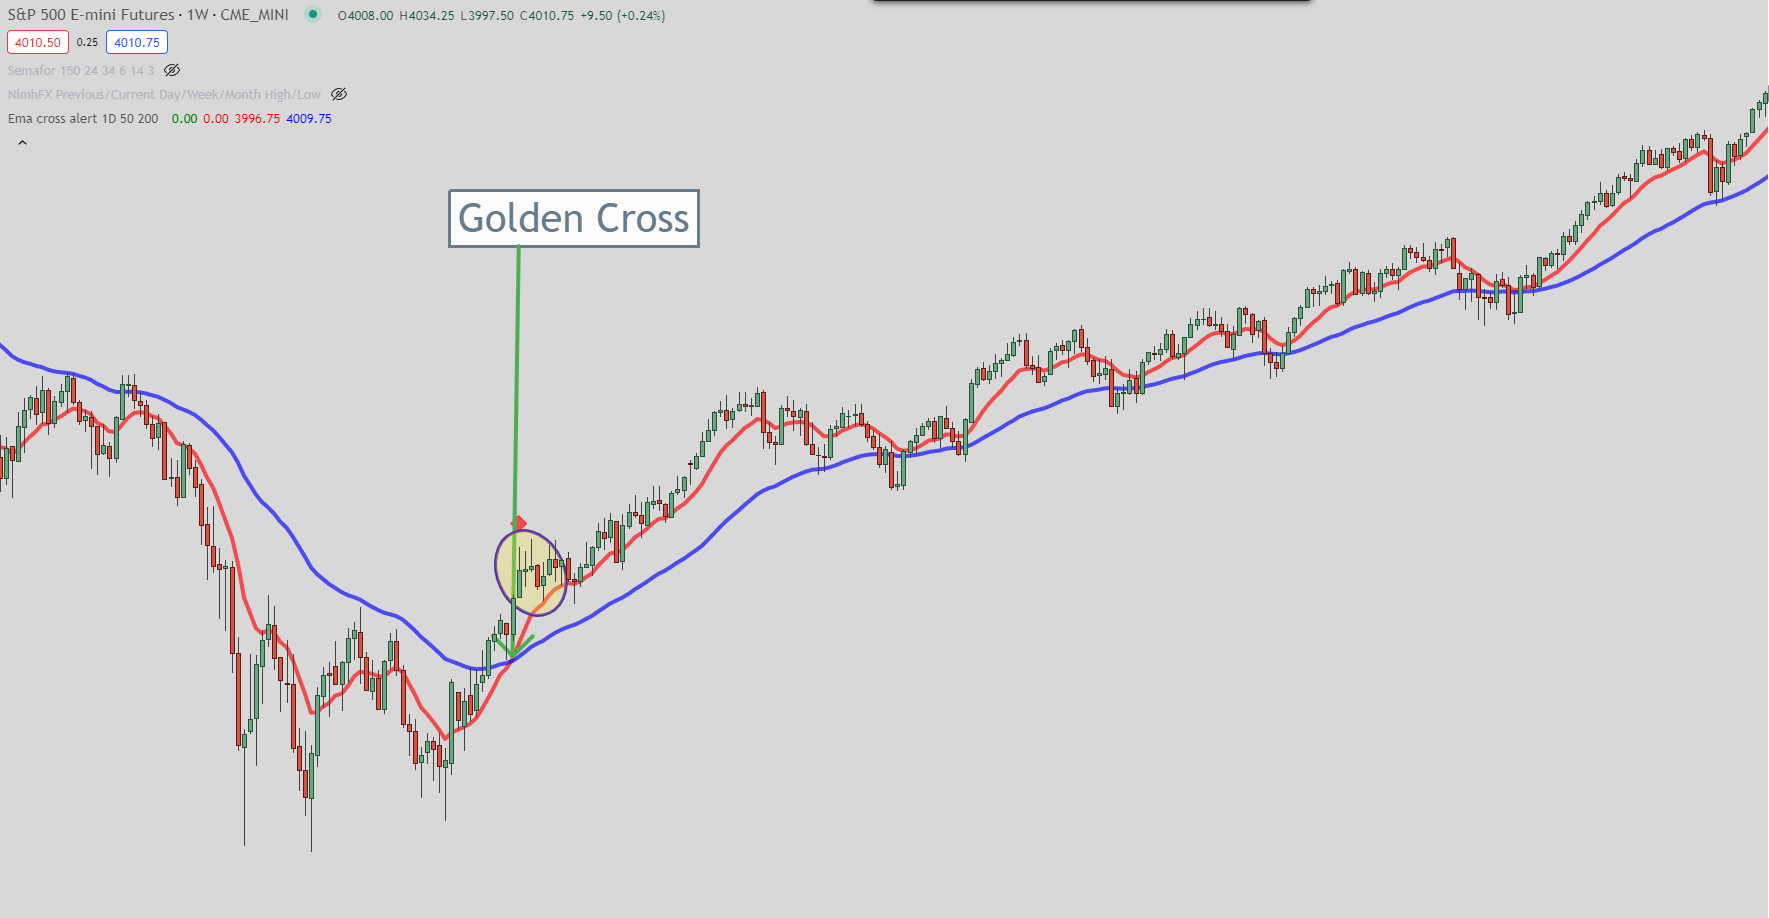
The most commonly used moving averages are the 50-day and 200-day moving averages. When the 50-day moving average crosses above or below the 200-day moving average, it is called a golden cross.
One of the strengths of the golden cross trading strategy is that it is simple to use and understand. It is a widely recognized chart pattern, and many traders use it to make trading decisions. The golden cross can provide a clear signal to traders that a bullish trend is likely to continue. Then they can enter a long position in the market.
However, the golden cross is not infallible, and it can produce false signals, especially in a range-bound market. Traders need to use other technical indicators and analyses to confirm the trend and avoid getting caught in a false breakout that we will discuss.
Another Approach?
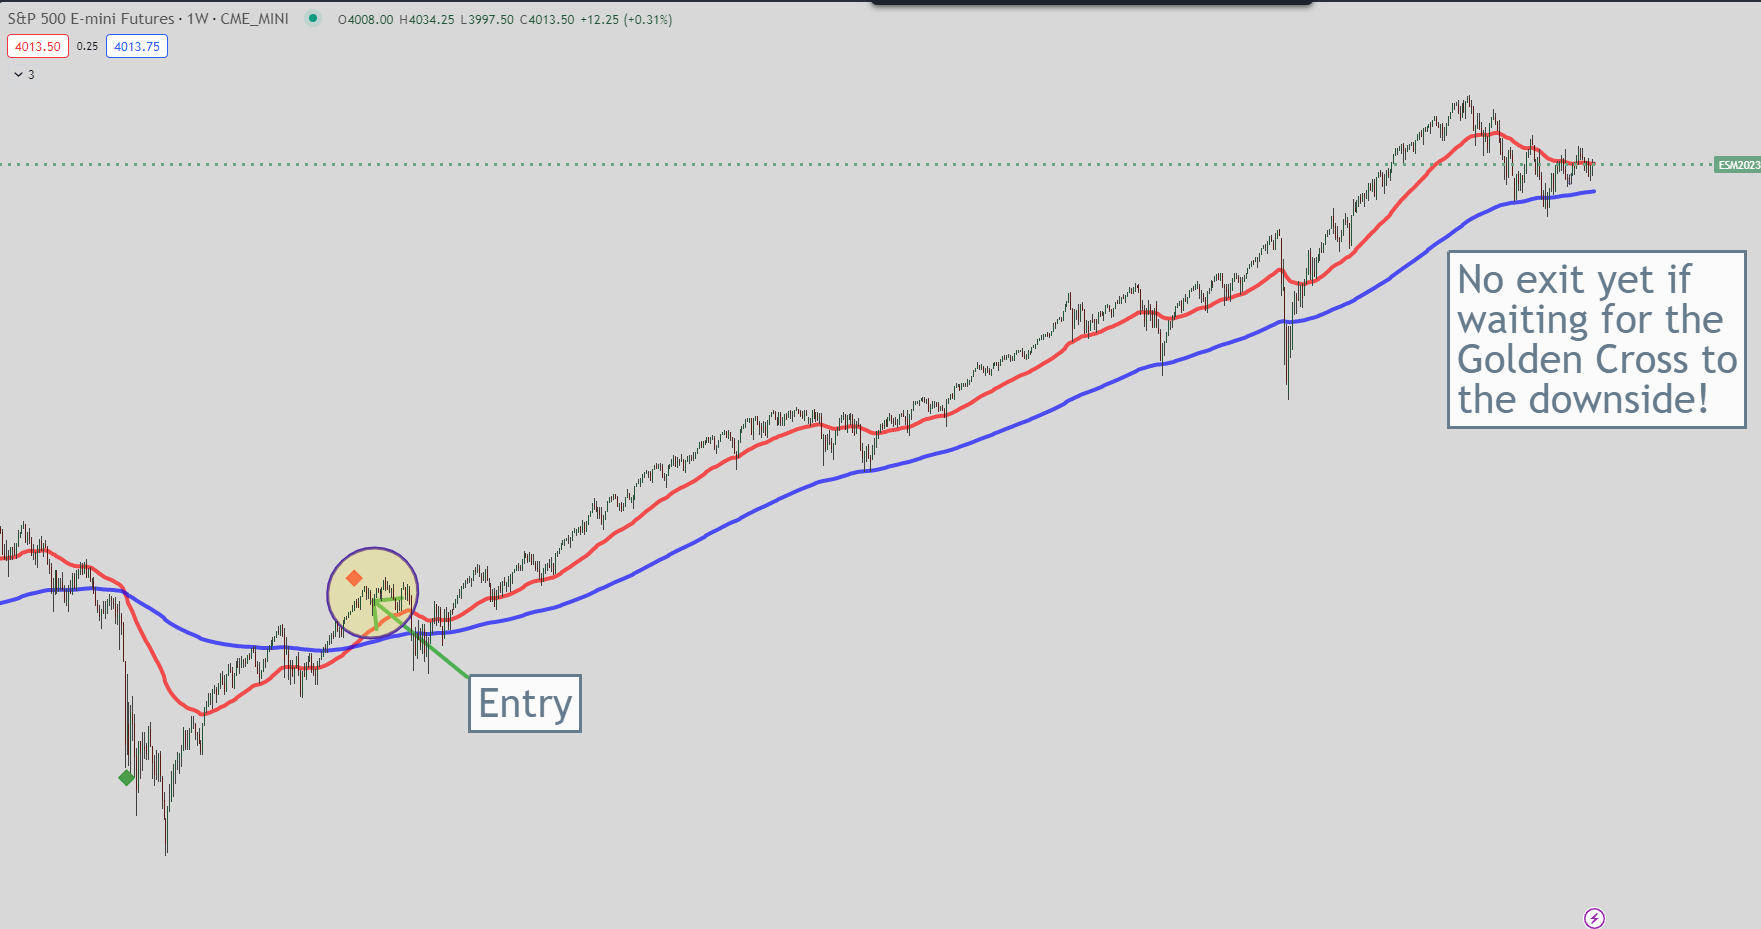
Traders can use different approaches to trade the golden cross. One approach is to wait for the golden cross to occur and then enter a long position in the market.
Another approach is to wait for a pullback or a retracement after the golden cross. Then enter a long position such as I spoke about in this article: https://evancarthey.com/moving-average-crossover-trading-strategy/.
Traders can also use other technical indicators such as the Money Flow Index (MFI) or the Moving Average Convergence Divergence (MACD). This will help confirm the trend and set their stop-loss and take-profit levels. I will show other options as well in a video down below in this article. Also, check out the link above to the article that has a totally different way to trade the Golden Cross using Fibonacci levels.
What is the Golden Cross Trading Strategy?
This strategy involves the use of two moving averages, a short-term moving average, and a long-term moving average. The most popular moving averages to use are the 50-day moving average and the 200-day moving average.
When the short-term moving average crosses above the long-term moving average, it is considered a golden cross, indicating a potential bullish trend (can be bearish also if looking for a downtrend). The golden cross is a signal to traders to buy the asset as they expect the price to rise.
The Golden Cross Trading Strategy is widely used in the stock market, forex market, and other financial markets. It is one of the most popular trading ideas because it is very easy to see on any time frame and any chart. Traders can use this strategy to identify potential trading opportunities and to make informed decisions about when to enter and exit trades.
It is easy to understand and apply, even for novice traders. Additionally, it is a reliable method of identifying potential bullish trends in the market, which can lead to profitable trades.
However, there are also some weaknesses to the Golden Cross Trading Strategy. One of the main weaknesses is that it is a lagging indicator. This means that the signal is generated after the trend has already begun, which can result in missed opportunities and false signals.
Video of the Golden Cross Trading Strategy
You will never buy at the bottom or sell at the top because, by the time the Golden Cross has formed then, the price has moved away from its previous top or bottom. Additionally, the strategy does not work well in volatile markets, where prices can quickly change direction and move back and forth in a range as we will discuss later.
Despite its weaknesses, the Golden Cross Trading Strategy remains a popular and effective method for traders to identify potential bullish or bearish trends in the market. By using this strategy in conjunction with other technical analysis tools and risk management techniques, traders can increase their chances of making profitable trades but you need to backtest your strategy a lot using the Golden Cross before you attempt to trade real money.
Strengths of the Golden Cross Trading Strategy
Long-term Trend Identification
The Golden Cross Trading Strategy is known for its ability to identify long-term trends in the market.
This is because it uses two moving averages, one short-term and one long-term, to analyze the price movement of a security. When the short-term moving average crosses above the long-term moving average, it signals a bullish trend in the market.
As mentioned earlier the most popular inputs are the 50 and 200 but you can use whatever you want to use. I’ve seen people use the 9 and 30 for day trading as well as the 21 and 55.
This makes it easier for traders to identify the direction of the trend and make informed trading decisions.
Simple and Easy to Use
Another strength of the Golden Cross Trading Strategy is its simplicity. It is easy to understand and use, making it a popular choice for both novice and experienced traders.
The strategy only requires the use of two moving averages, which can be easily plotted on a chart. This makes it a straightforward and effective tool for traders who want to analyze the market. It also assists you in making informed trading decisions.
The two most popular moving averages to use are the 50-day and 200-day moving averages. You can use any number you wish but the 50 and 200 moving averages are the most popular.
Widely Used and Tested
The Golden Cross Trading Strategy is a widely used and tested strategy in the trading community.
It has been used for many years and has proven to be effective in identifying long-term trends in the market. This strategy has been tested by many traders and has been found to be reliable and accurate in predicting market trends.
This makes it a popular choice for traders who want to make informed trading decisions based on reliable data.
In conclusion, the Golden Cross Trading Strategy is a simple and effective tool for identifying long-term trends in the market. Its strengths lie in its ability to provide traders with a clear direction of the trend and its simplicity, making it easy to use for both novice and experienced traders.
Additionally, it has been widely used and tested, making it a reliable tool for traders who want to make informed trading decisions based on accurate data.
The Trading Rush YouTube channel backtested it 100 times, here is the video:
Weaknesses of the Golden Cross Trading Strategy
Lagging Indicator
The Golden Cross Trading Strategy is a trend-following strategy that relies on moving averages. However, moving averages are lagging indicators, which means that they are based on past price data and may not accurately predict future price movements.
This lag can cause traders to enter or exit trades too late, resulting in missed opportunities or losses. But the main reason why lagging indicators receive such criticism is that they ensure you will never be selling at the top and buying at the bottom.
The price will have already happened by the time the signal forms on your charts.
False Signals in Choppy Markets
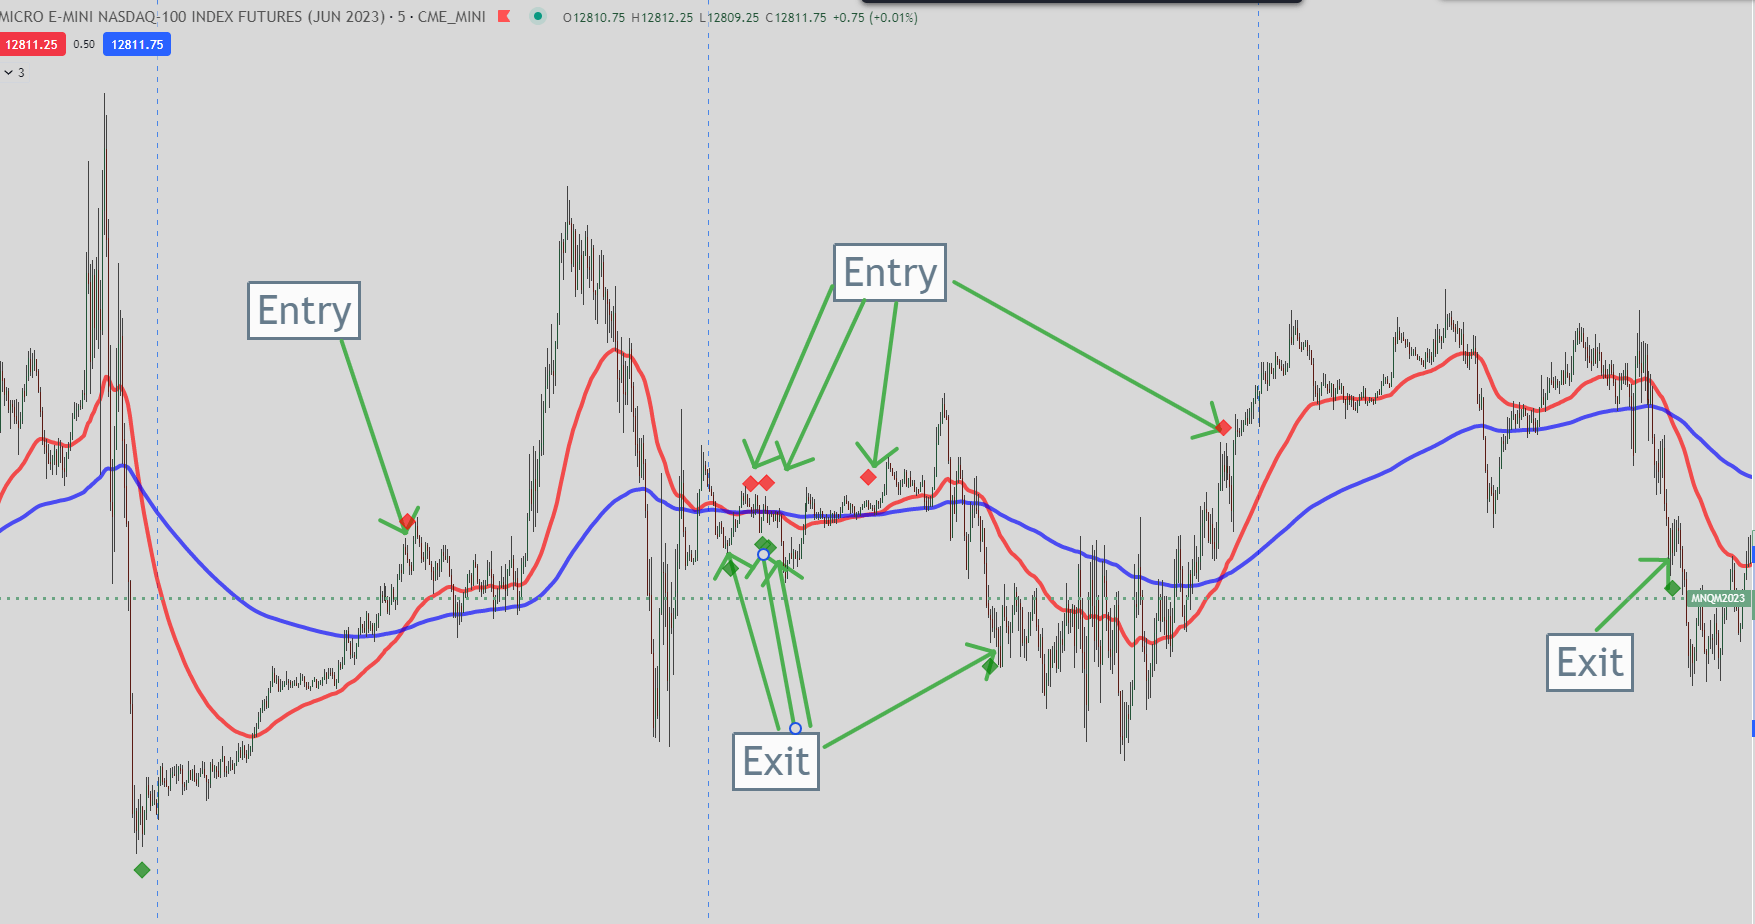
The Golden Cross Trading Strategy can generate false signals in choppy markets. In these markets, the moving averages may cross over multiple times, resulting in conflicting signals. Traders may enter or exit trades based on these false signals, resulting in losses.
It has been said that a market is in a range 70% of the time and trends only 30% of the time. How accurate that is I’m not sure but there is a ranging market enough of this time to bankrupt you if you follow this strategy blindly.
This is the main reason why in theory the Golden Cross Trading Strategy sounds amazing but when you start to backtest it you soon find that if you cannot differentiate between a ranging market and a trending market then you will lose a lot of money trying to trade this strategy.
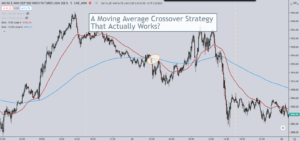
In the picture below look at all of those entries and exits! Choppy markets are not your friend with this trading strategy.
Does Not Work in All Markets (Choppy Markets)
The Golden Cross Trading Strategy does not work in all markets. It is most effective in trending markets, where the moving averages are clearly separated and the trend is strong.
In range-bound markets, where the price is moving sideways, the Golden Cross Trading Strategy will generate false signals or result in missed opportunities or worse yet, lots of lost money.
Despite these weaknesses, the Golden Cross Trading Strategy can be a useful tool for traders to see if the market is in a big trend.
By combining it with other technical indicators (such as the MFI indicator as described in my video above) and fundamental analysis, traders can increase their chances of success. The main idea to remember is to NOT use this strategy in a range-bound market.
Markets move in this pattern:
- Range
- Trend
- Range
I’ll write another article covering this topic because if you look for this then spotting a market whether it is trending or range bound becomes much easier.
Examples of How to Trade the Golden Cross Trading Strategy
Example 1: S&P 500
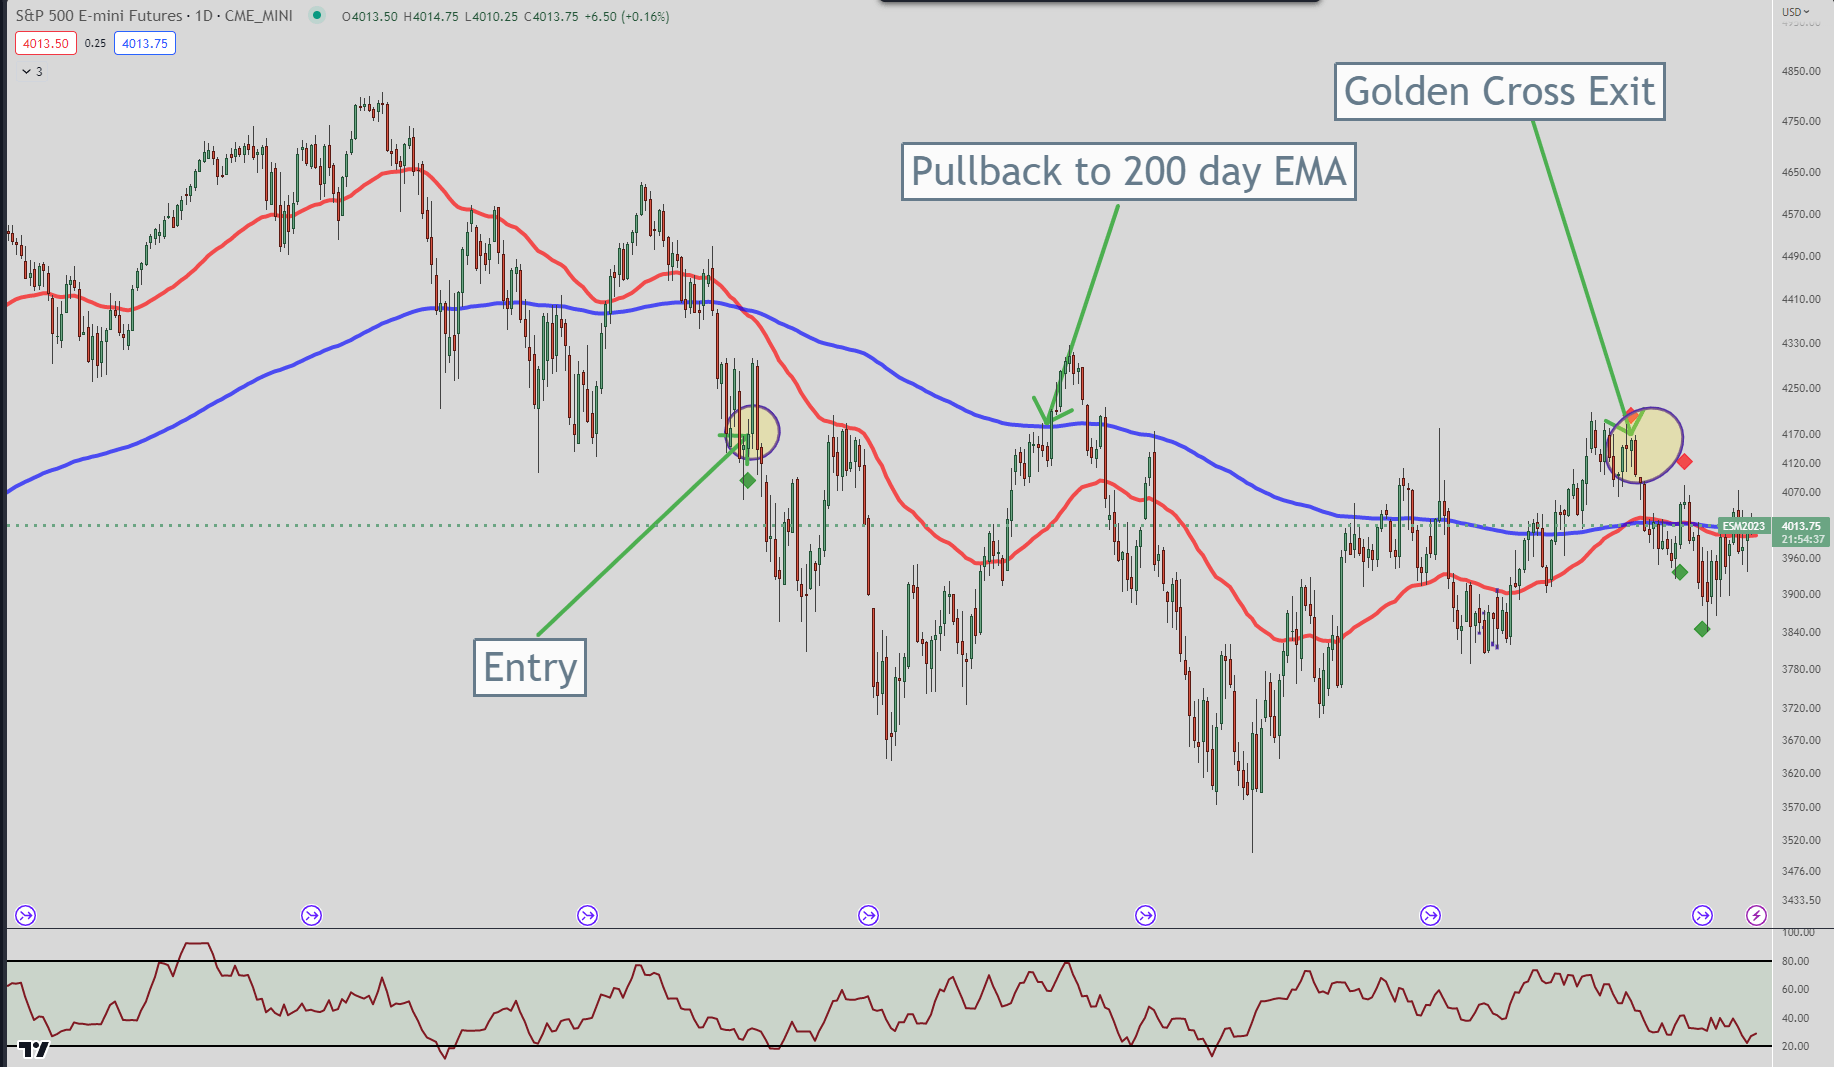
The S&P 500 is a popular index used by traders to gauge the overall health of the US stock market. In early 2022, the S&P 500 experienced a Golden Cross when the 50-day moving average crossed below the 200-day moving average. Traders who were following this strategy may have entered a short position at this point, expecting the market to continue its downward trend.
But as you can see from the image below the best you could have done if you were using an exit to the 200-day EMA or the Golden Cross Exit would have been a small loss.
Example 2: Apple Inc.
Apple Inc. is a popular stock among traders and investors. This makes it a good candidate for using the Golden Cross strategy. In April 2019, Apple experienced a Golden Cross when the 50-day moving average crossed above the 200-day moving average. Traders who were following this strategy may have entered a long position at this point, expecting the stock to continue its upward trend.
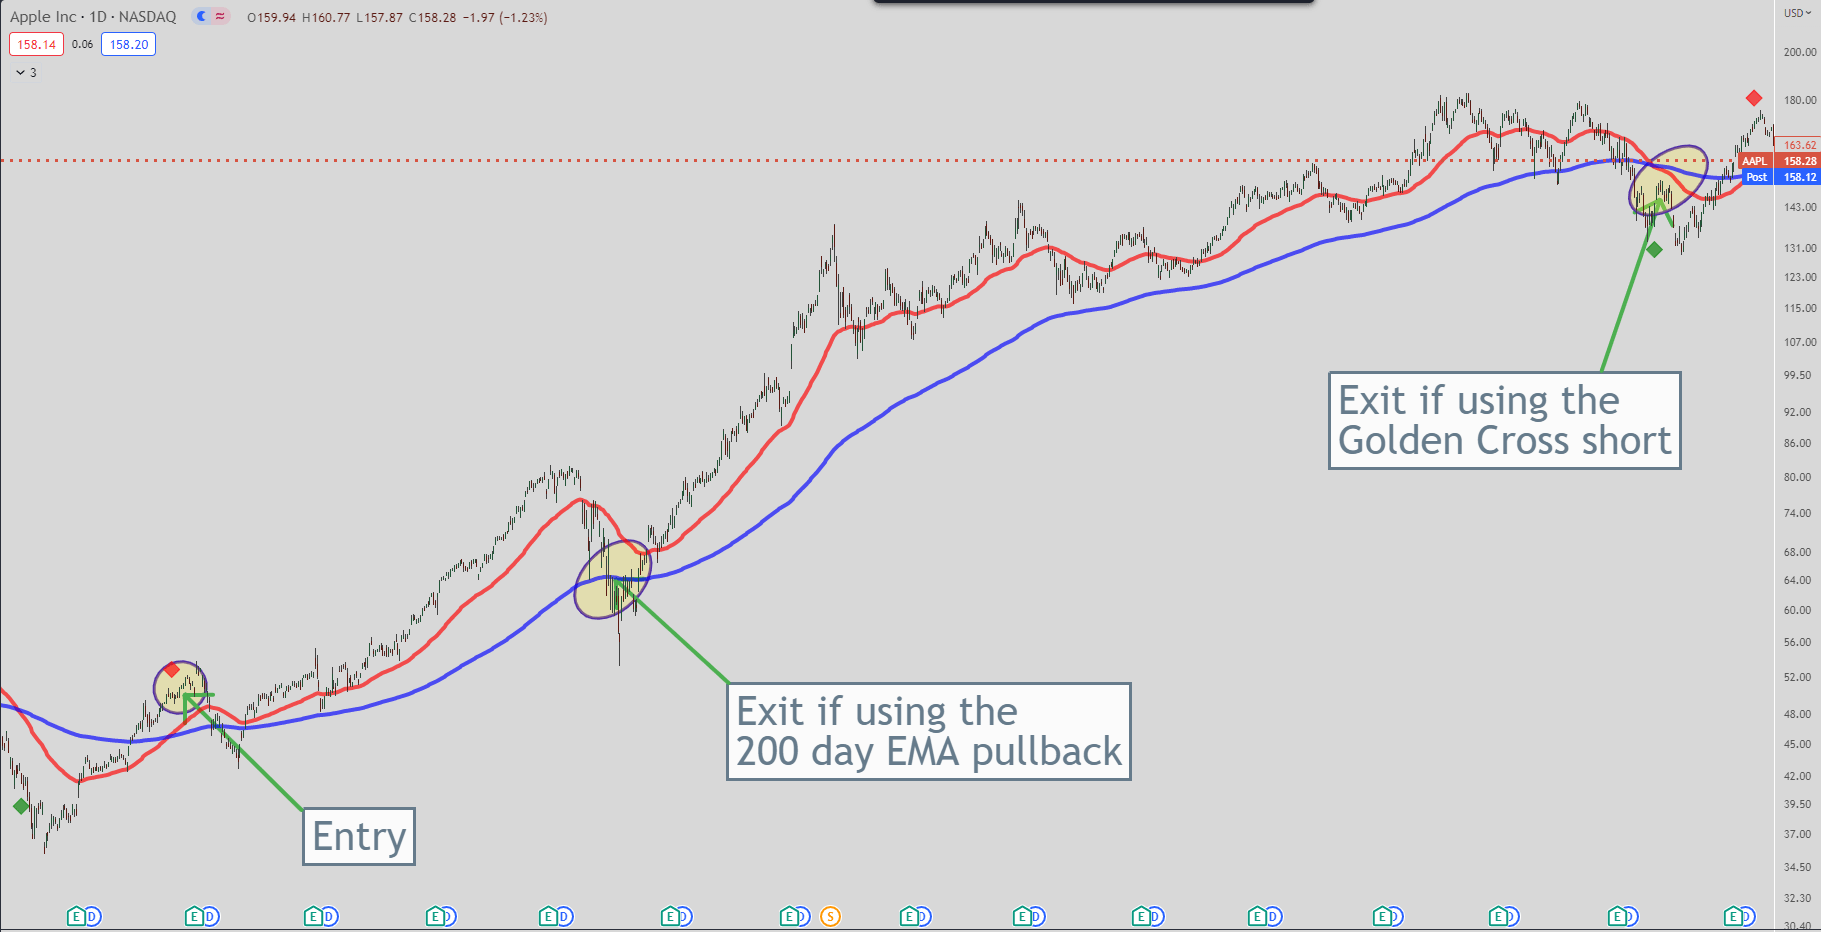
As with the S&P 500 example, it’s important to note that the Golden Cross is not always accurate. Traders should use other analyses and indicators to confirm their trades. In this example, the Apple trade using this strategy would have worked out very nicely.
Overall, the Golden Cross trading strategy can be a useful tool for traders to identify potential buying opportunities in a market or stock. However, it should not be relied upon as the sole indicator for making trades. It should always be used in conjunction with other analyses and indicators.
Conclusion
Congratulations! You have reached the end of this article on the strengths and weaknesses of the Golden Cross Trading Strategy. Hopefully, by now, you have a better understanding of what this strategy entails and whether it is a good fit for your trading style.
As a quick recap, the Golden Cross Trading Strategy involves using the crossover of two moving averages to determine when to buy or sell a security. This strategy has been known to work well in trending markets. But it can also lead to false signals and whipsaws in choppy markets.
One of the main strengths of the Golden Cross Trading Strategy is its simplicity. It is easy to understand and can be implemented by traders of all levels. Additionally, it can be used on a wide range of securities and timeframes.
However, one of the main weaknesses of this strategy is that it can lag behind the market. This means that by the time the crossover occurs, the security may have already made a significant move. This would result in missed opportunities. Additionally, false signals can lead to losses if traders are not careful.
In conclusion, the Golden Cross Trading Strategy can be a useful tool for traders. But it is not without its drawbacks. As with any trading strategy, it is important to thoroughly test it and understand its strengths and weaknesses before implementing it in your trading plan.
Here are a couple of other articles that talk about the Golden Cross Trading Strategy:
-
Golden Cross vs. Death Cross: What’s the Difference? – (https://www.investopedia.com/ask/answers/121114/what-difference-between-golden-cross-and-death-cross-pattern.asp#:~:text=The%20golden%20cross%20occurs%20when,term%20average%2C%20until%20they%20cross)
-
Golden Cross Pattern Explained With Examples and Charts – (https://www.investopedia.com/terms/g/goldencross.asp)

