Last week there was great action in the S&P 500. Volatility has come back which is great if you are a day or swing trader. This post will be how to trade the S&P 500 for the week of 5-20-2019. We will specifically look at the ES or the e-minis to see what to expect based upon my trading setups. We will look at the daily, 1-hour, and 15-minute chart. Maybe even the 5-minute chart as well.
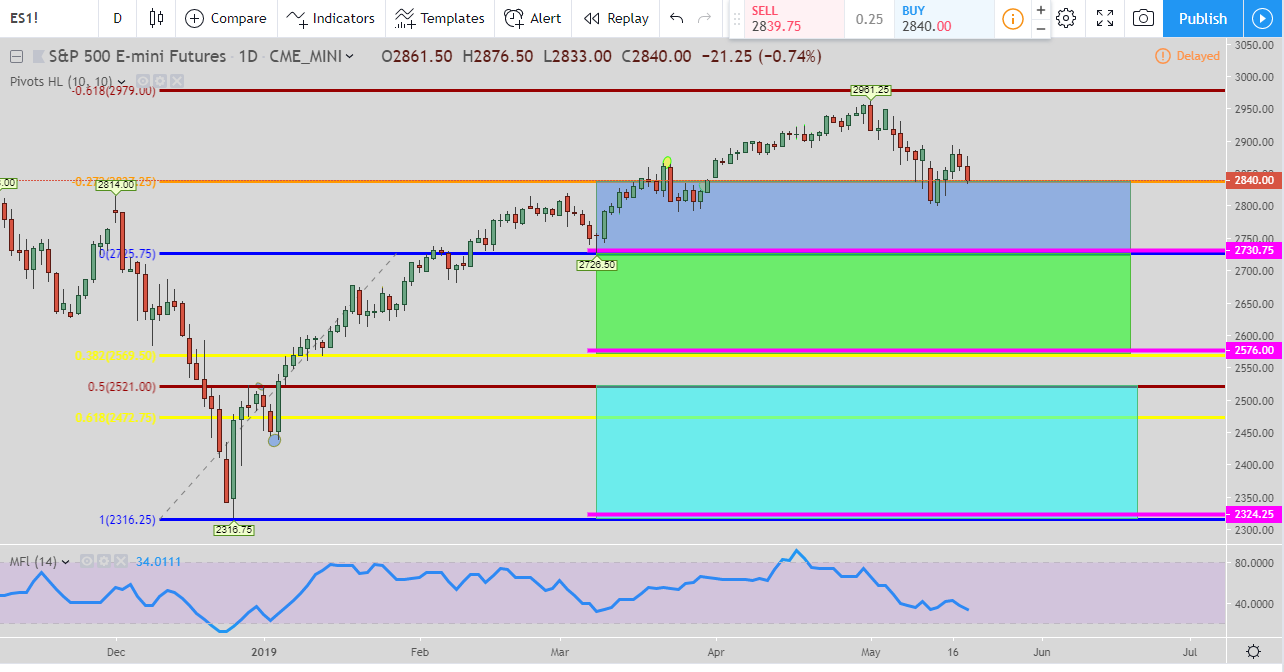
S&P 500 daily chartFrom this daily chart setup we are looking for a 127 long setup. The pink lines are the entry levels and the top of the colored boxes are the exits. But if one of the exits hit then we do not look to enter in again. The move is over and time to look for a new setup. With the MFI (Money Flow Index) indicator getting lower, it looks like price is getting ready to bottom out before another move higher.
I would like to see a touching of 2,730.75 in order to initiate this trade and start the next leg up. It may not happen so all we can do is wait for this pattern to initiate.
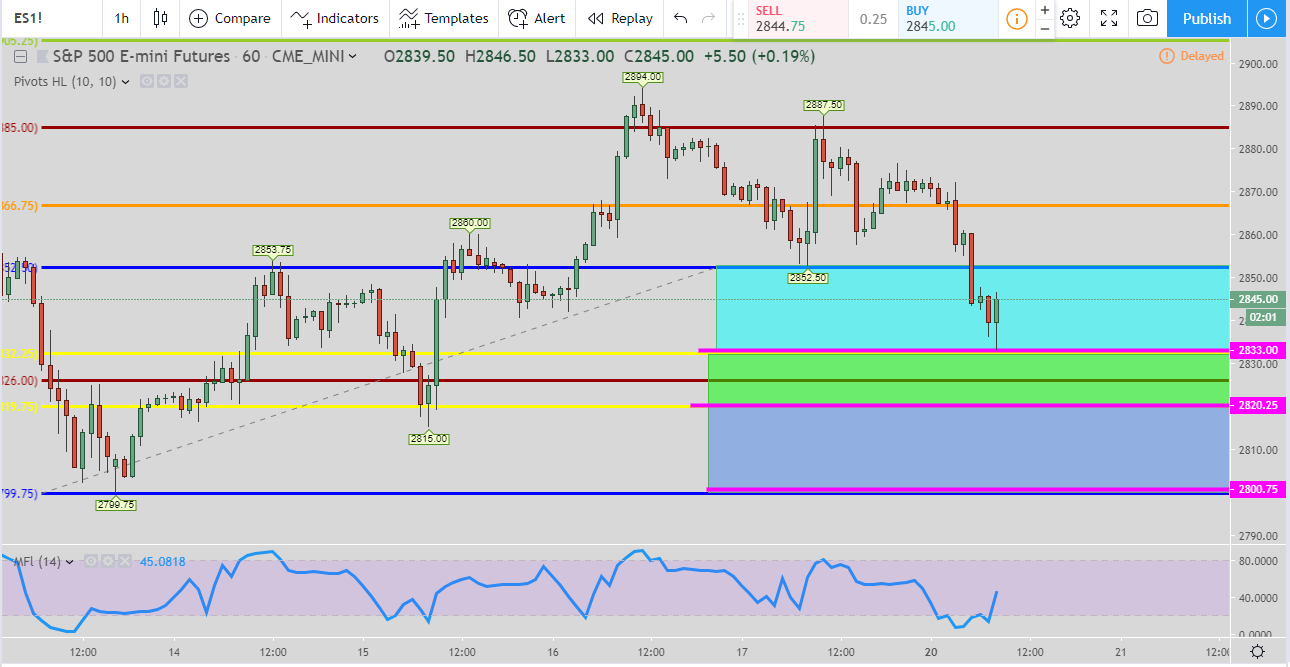
In the 1-hour chart, there is currently a setup that is live. It is the 61B long setup. When the price went down and hit the pink line today it initiated the trade. The current exit is at the top of the teal box. The pink levels are the entries. But if the price continues to move up and hit the top of the teal box then the move is over and you do not get in at the other two entry levels. It will be time to look for a new setup.

Here in the 15-minute chart, we have another 61B long setup. It initiated when the price hit the top pink line. You can see how price came very close to hitting the 2nd pink line but didn’t quite make it so the current exit is still the top of the teal box at 2859. But if price does go down and hit the 2nd pink line at 2832 then the exit moves to the top of the green box at 2842. As soon as one of the exits is hit then the move is over and you do not get in anymore. We will look for a new trade.
Conclusion of How to Trade the S&P 500 for the Week of 5-20-2019
The S&P 500 seems to be setting itself up for at least a short term buying opportunity. There is already one underway in the 15-minute chart. The 1-hour chart is very close and we are waiting on the daily chart to initialize. Even if price does continue to move lower then it will setup further buying opportunities. So in my opinion, any weakness would be considered a buying opportunity.
Popular Links
Here are a couple of links if you are looking at how I view the market and some trade setups. You can create your own trading style and setups. Quit paying losing traders to teach you. The only thing they teach is how to lose money.
Robinhood Trading Broker
If this post benefits you and if you haven’t used Robinhood for trading stocks but are thinking to then please consider using my referral link when you do sign up: http://share.robinhood.com/evanc203.
This way each of us will receive a free share of a random stock if you sign up through my referral link.
My Robinhood Review: https://evancarthey.com/review-robinhood-trading-service-with-no-fees-part-1/

