Recently Bitcoin has been on a strong uptrend. This post will be about how Bitcoin (BTC) is Going Parabolic Today – Should You Buy or Sell? When a trading instrument goes straight up for a bit then almost every time the retracement is right around the corner. That is what I see happening based upon a setup I am going to share with you today.
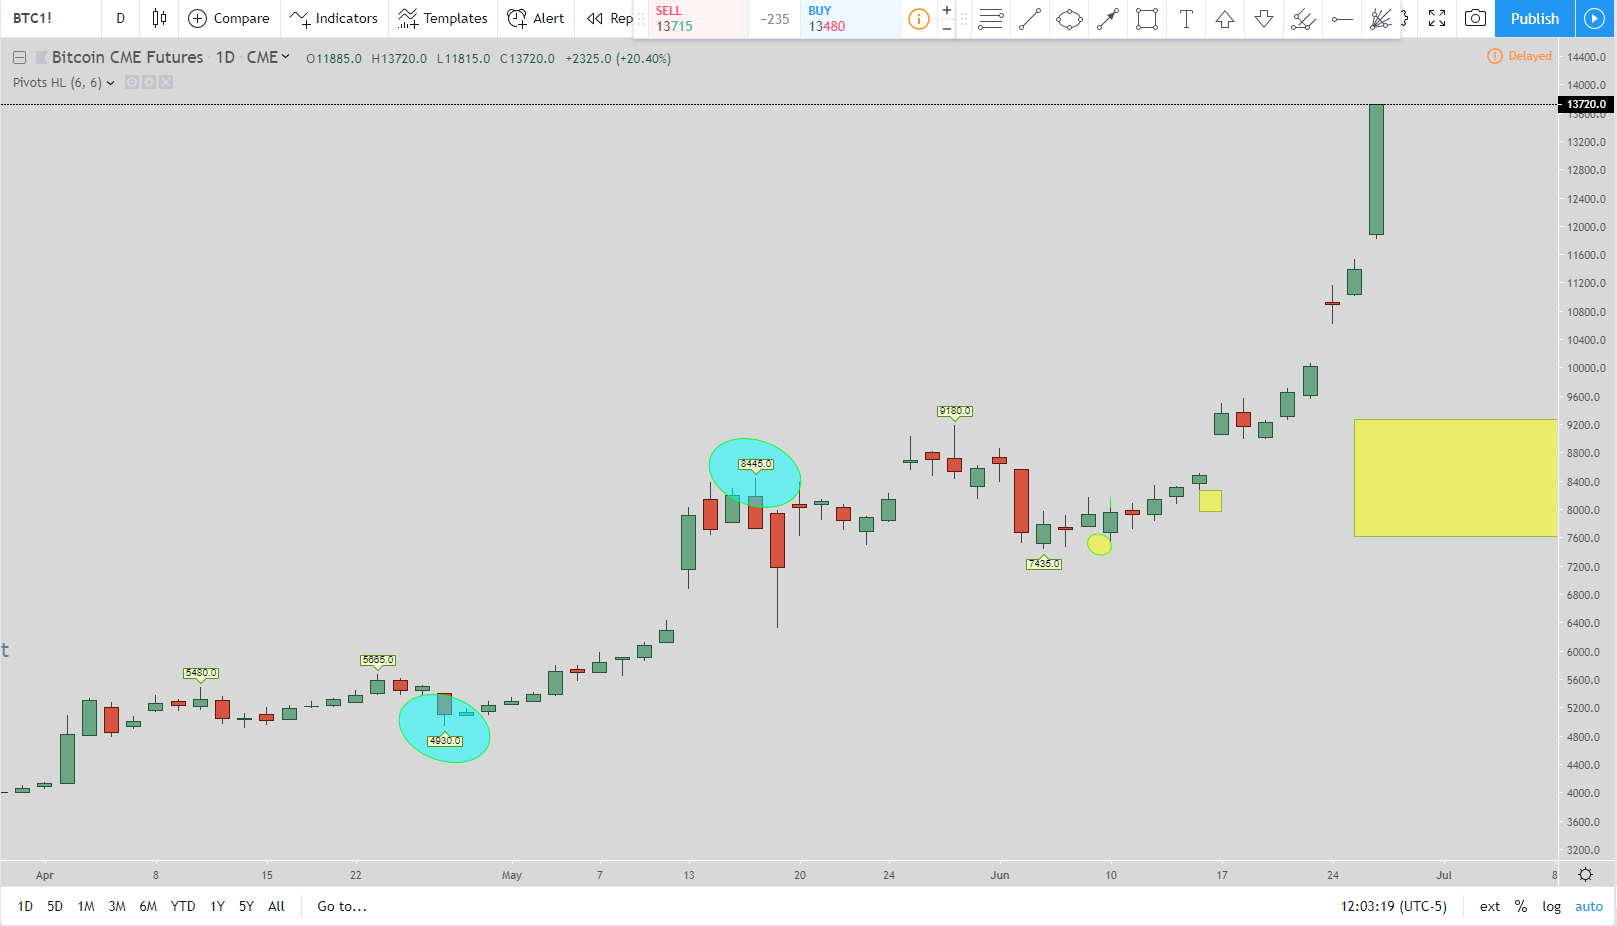
At the time of this writing Bitcoin (BTC) is around $13,750. In looking at the chart you can see how it has been going almost straight up the past couple of days. One item to note is the two gaps that happened recently in the uptrend. Actually there are 3 gaps the closer I look at it. Gaps in an uptrend come back and get filled around 90% of the time so that is one reason why I wouldn’t be a buyer right now.

The setup we are looking at today is my Springboard setup. The theory of it is the 123.6% Fibonacci extension being missed and a retracement being fulfilled. Based upon my exits the retracement did not complete all the way so it is still live.
There is also one other setup to the short side that I will talk about in a minute but for right now I am focusing on the Springboard short.
When price originally missed the 123.6% Fibonacci extension I was looking at the 50% Fib retracement (the red line) to be hit. But once price went back up and hit the 0% line then I moved the exit to the 23.6% retracement (the purple line). Finally, once price went back up and hit the 123.6% extension then the final exit moves to the 23.6% line which is the purple line and also at the bottom of the yellow box. So that is where the exit remains until it comes back and completes the trade.
As you can see price has gone against it the other direction by a good amount.
The 123-161 Short Trade
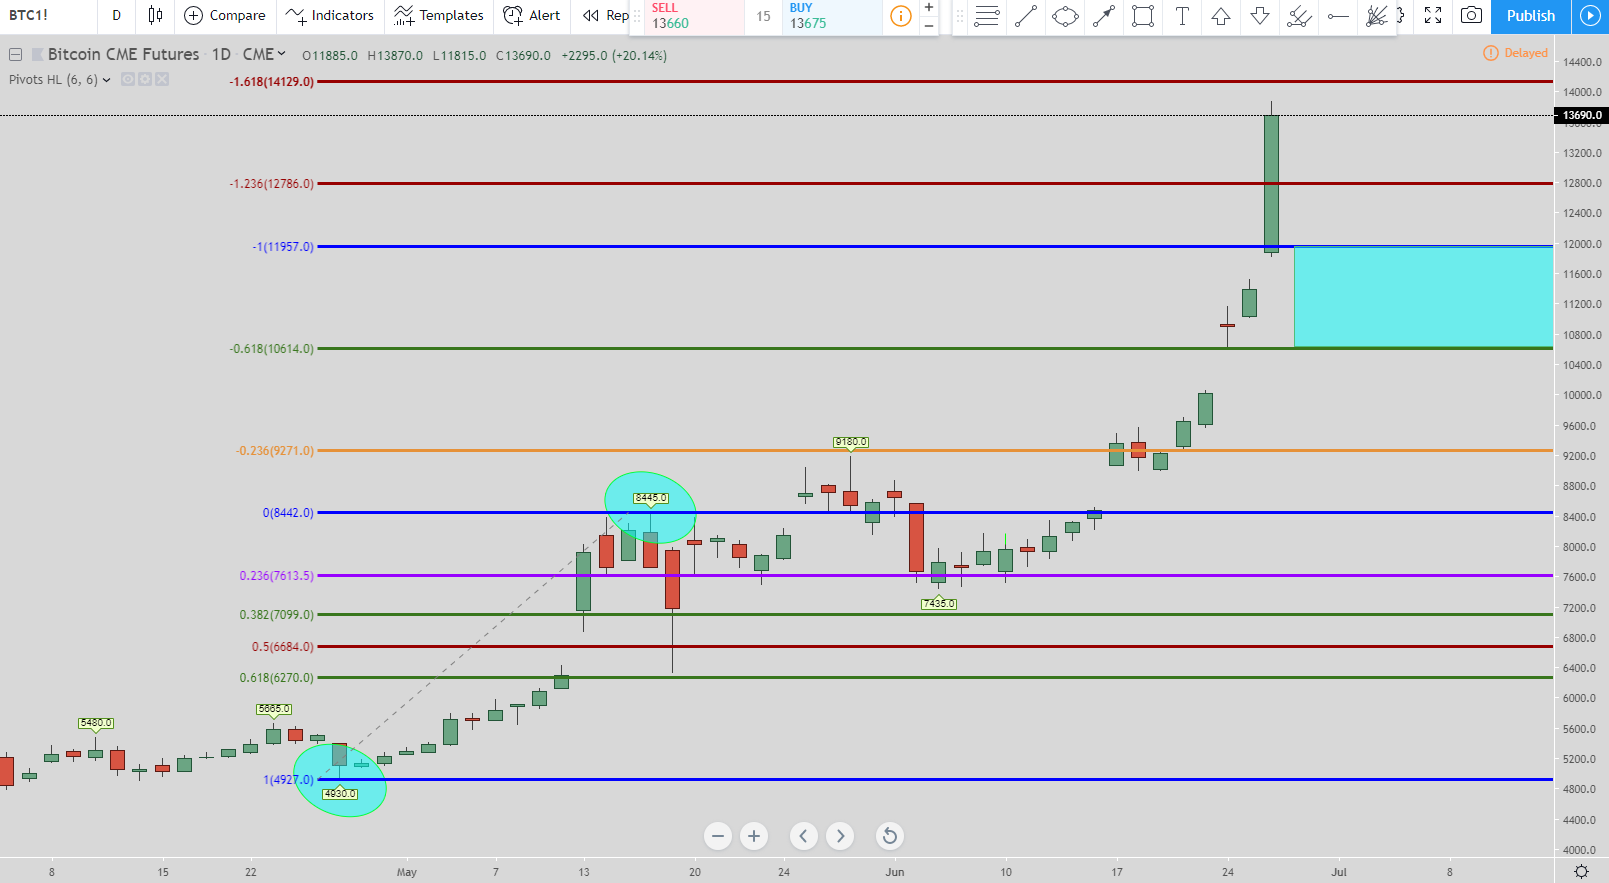
For the 123-161 short trade we can use the same pivot points as before that are highlighted by the teal circles. What we look for is price to hit the 123.6% Fibonacci extension level. Once it does then the exit is the 0% line (blue line). But since that never happened then the next entry was the 161.8% extension level (green line). That would move the exit to the 123.6% level (the orange line). That never happened either.
Finally, once price hits the 200% Fib extension level (the blue line and the top of the teal box) then that is the next entry. The exit then moves to the bottom of the teal box at around $10,650. This is the last time the exit moves. As you can see you can get in even better now since price has continued to move up.
So the exit we are looking for during this setup is the bottom of the teal box at around $10,650.
Conclusion for Bitcoin (BTC) is Going Parabolic Today – Should You Buy or Sell?
I am bearish for Bitcoin based upon the two setups I mentioned above. I do think long term Bitcoin can go much higher. But based upon how I trade and what I look for I would be more inclined to short the stock than to be a buyer right here.
I think we are in for some big profit taking in the near future. For full disclosure I sold the little Bitcoin I still had left once price hit the $13,000 mark. I am waiting for price to retrace back to around the $8,000 level before I think about purchasing again.
Popular Links
Here are a couple of links if you are looking at how I view the market and with my trade setups as well as products I like and use.
- How to become a profitable trader using meditation
- How to scan for winning stocks
- Bread and Butter Trade
- How to Improve Your Meditation with the Brain Evolution System
- Review: Stikky Stock Charts – An Excellent Trading Book That is Interactive
Robinhood Trading Broker Review
If this post benefits you and if you haven’t used Robinhood for trading stocks but are thinking to then please consider using my referral link when you do sign up: http://share.robinhood.com/evanc203.
This way each of us will receive a free share of a random stock if you sign up through my referral link.
My Robinhood Review: https://evancarthey.com/review-robinhood-trading-service-with-no-fees-part-1/

