1 Moving Average Crossover Trading Strategy That Works?
One of the most recognized trading strategies that have ever been attempted is the moving average crossover trading strategy. It is also one of the most misunderstood trading strategies because almost every video or post describing how to trade it has you enter only when the cross happens.
I’ve tried that before just like almost anyone who has attempted to use indicators but was met with little to no success.
I am here to introduce you to a different way to enter into a trade using the moving average crossover trading strategy. It incorporates using the Fibonacci retracement and extension levels because you will now be waiting for a pullback after the crossover rather than getting in immediately when the crossover happens.
It isn’t difficult and is easy to learn. I have used it before and it works but you will have to adjust it to your own risk level tolerance. That is what trading is all about. So without further ado here is how it goes.
How the Setup Works
You can use any moving average indicator you would like to use. I prefer to use the 50 and the 250. I use the Exponential Moving Average (EMA) which uses the close of each candle to calculate the average. The 50 signifies it uses the past 50 bars and the 250 uses the past 250 bars to calculate the line on the chart in the examples I am going to show.
There is also a video below that goes into further detail with other examples so check it out when you get a chance.

Moving Average Crossover Strategy 1In the picture above you can see the 50 and 250 EMA. The 50 is the red line and the 250 is the blue line. We’ll dig in deeper and show a short and long setup. Nothing special about it, just standard stuff.
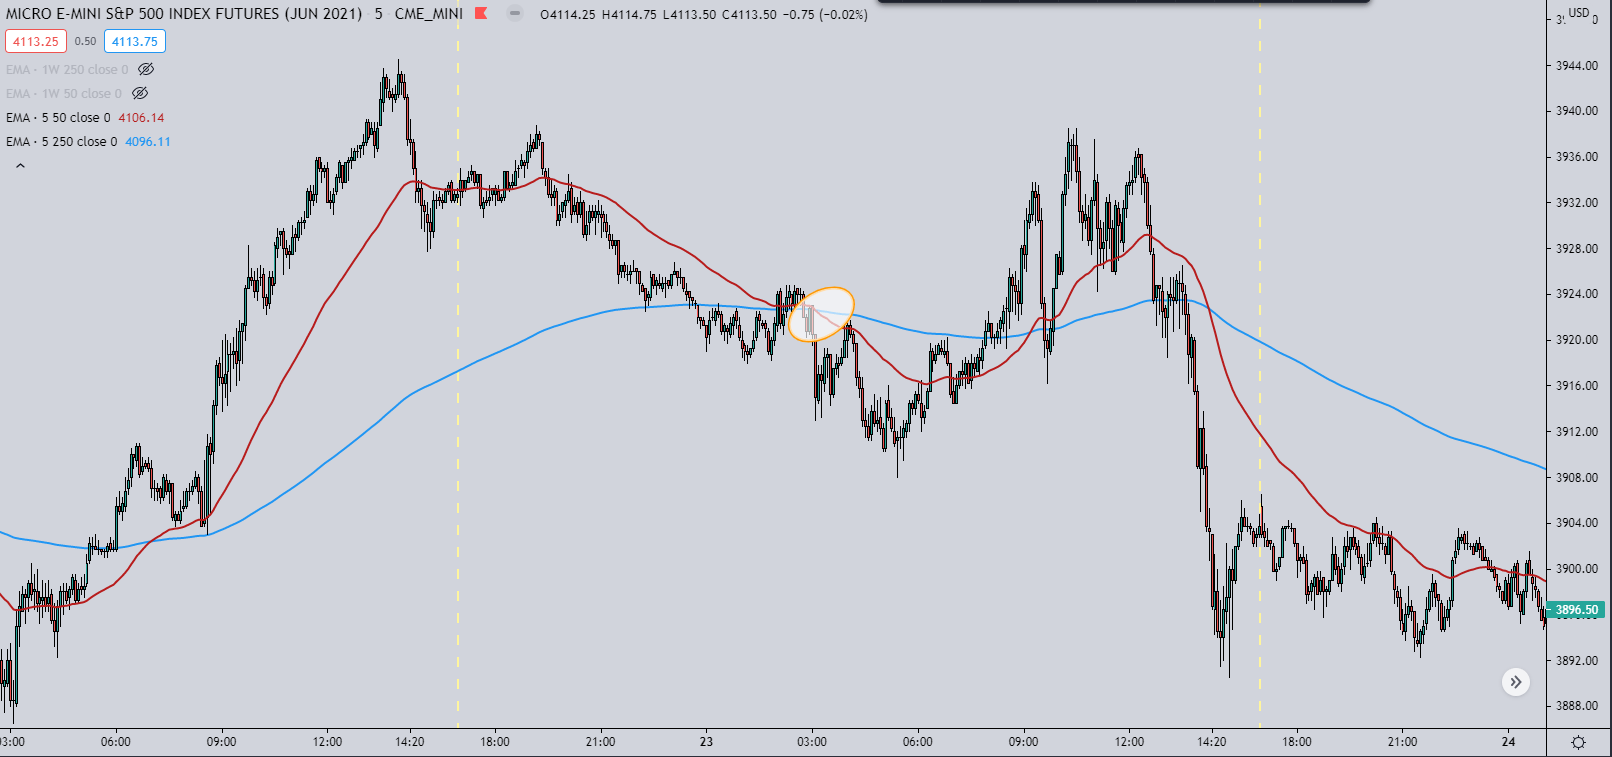
In the image above you can see that the orange circle is where the 50 EMA crosses over the 250 EMA which gives us the signal to look for in order to wait for the retracement to go short.
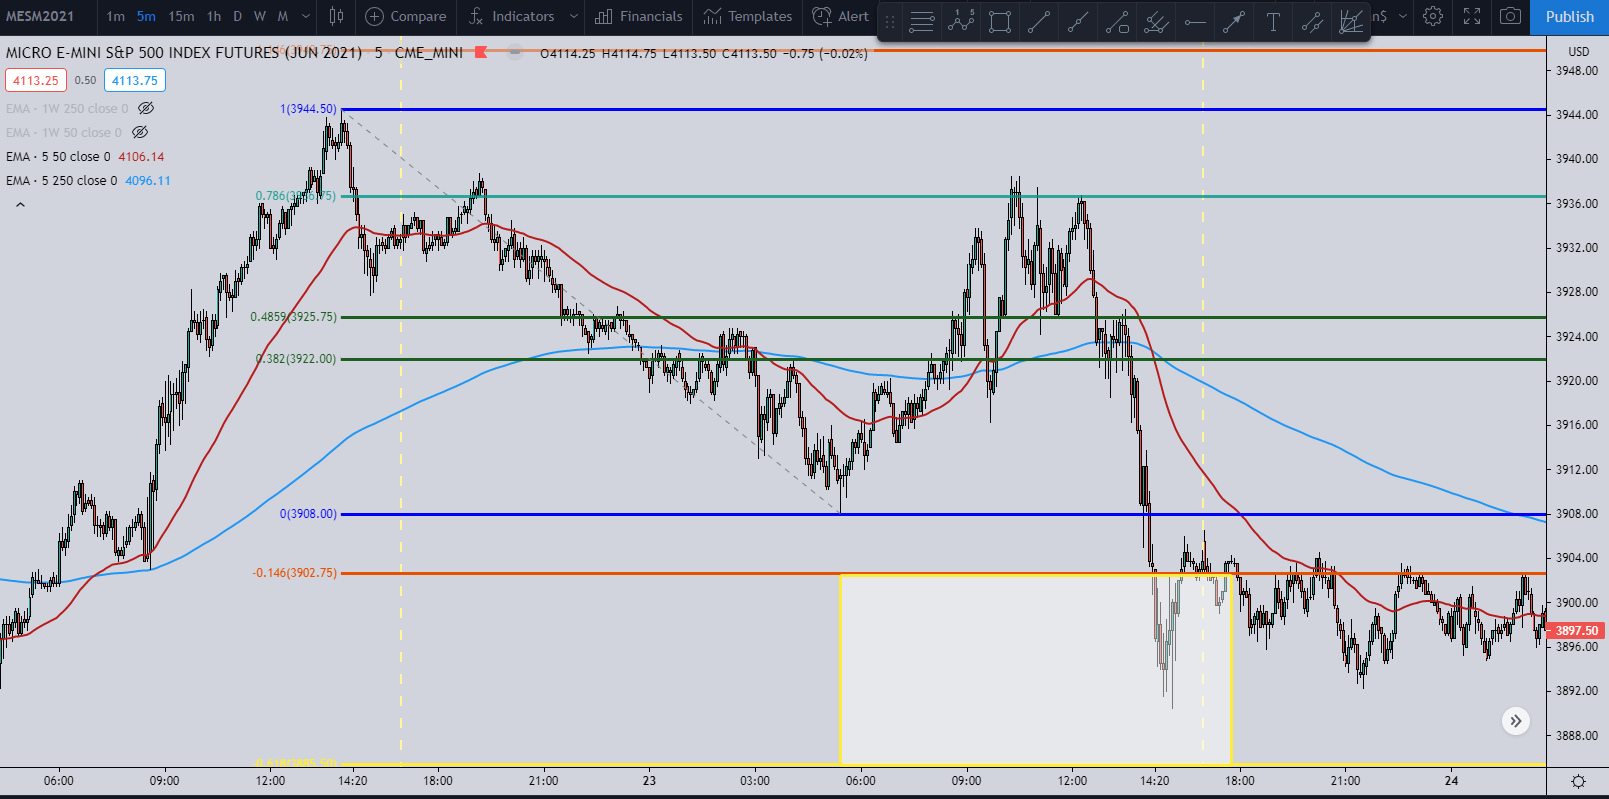
What we do from there is apply the Fibonacci retracement tool. I look for the last high from the past crossover to use for the high. Then for the low, I look for the pullback to the 38.2% level after the crossover happens. So the retracement is not in play until there is a retracement to the 38.2% Fibonacci level after the 50 EMA crosses the 250 EMA.
The target is the 1.416 Fibonacci extension level which is the orange line I highlighted with the yellow box. That is the ultimate target. Price of course can go past it but that is the target I use.
Now for the retracement level I initially get in for my first entry is the 50% level and my second entry is the 78.6%. The 78.6% in this example was where the price bounced off of before it reversed down and hit the target.
Obviously, it doesn’t always happen but when it does it gives you almost a 4:1 risk-to-reward ratio. So even if this trade only worked 30% of the time when the price hit the 78.6% level then it would still be a profitable setup.
The stop loss I have is just north of the 100% Fibonacci level which is the pivot high I use which is where the blue line at 3944.50 is located. So in this example, my stop loss would have been just a tick higher that the pivot high which would be at 3944.75.
Long Setup
For the long setup, it is the same as the short except now you are looking for the crossover to happen going to the upside.
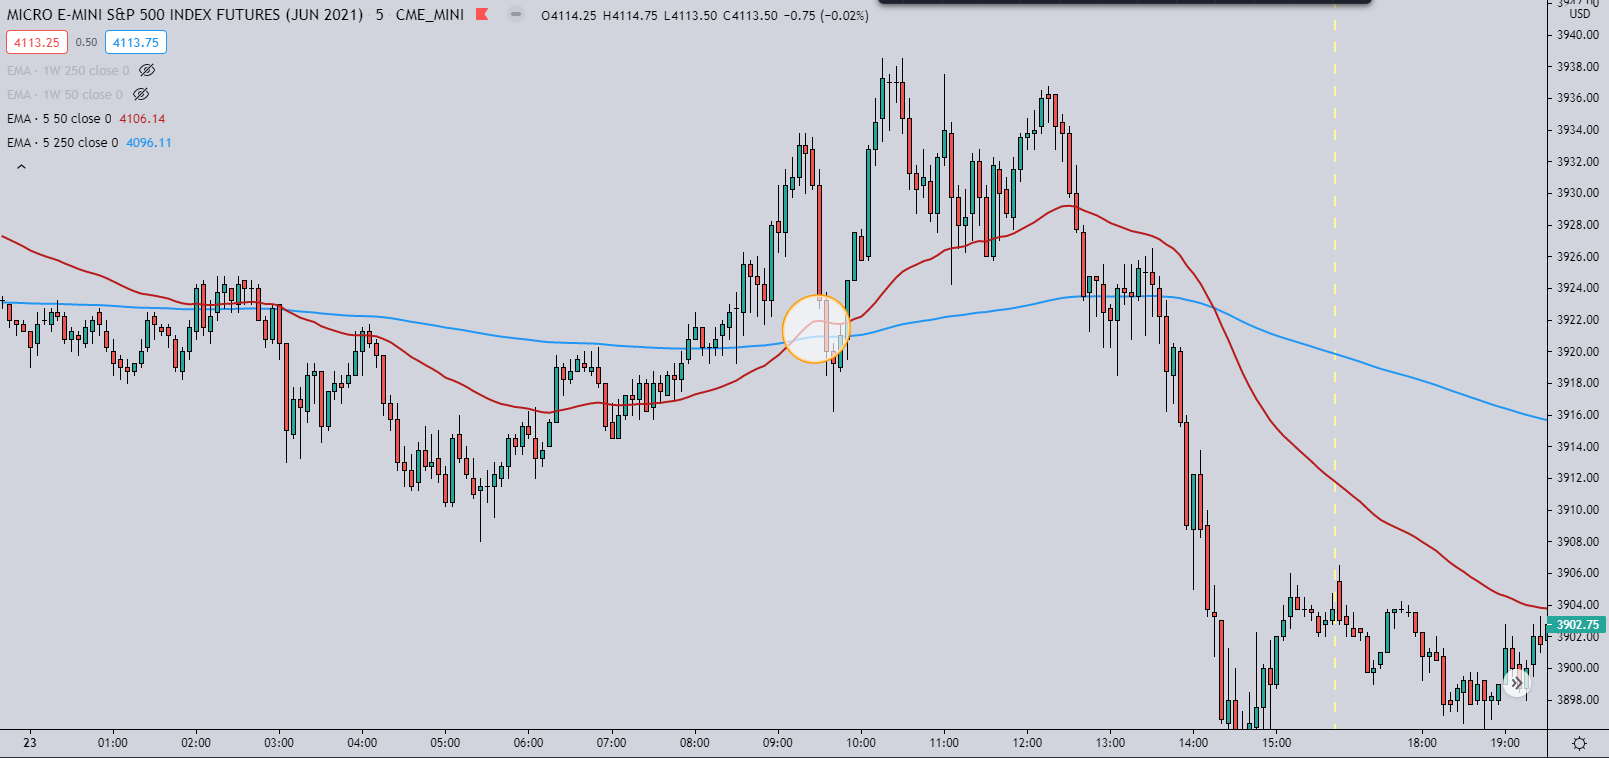
Here you can see the orange circle showing the 50 EMA crossing over the 250 EMA.
Once we have the crossover then we look for the lowest point before the crossover to get our anchor point which is at 3908. Then we keep on dragging the Fibonacci retracement line up until we get a pullback that is at least to the 38.2% retracement level. Then we have our high and the setup is live.
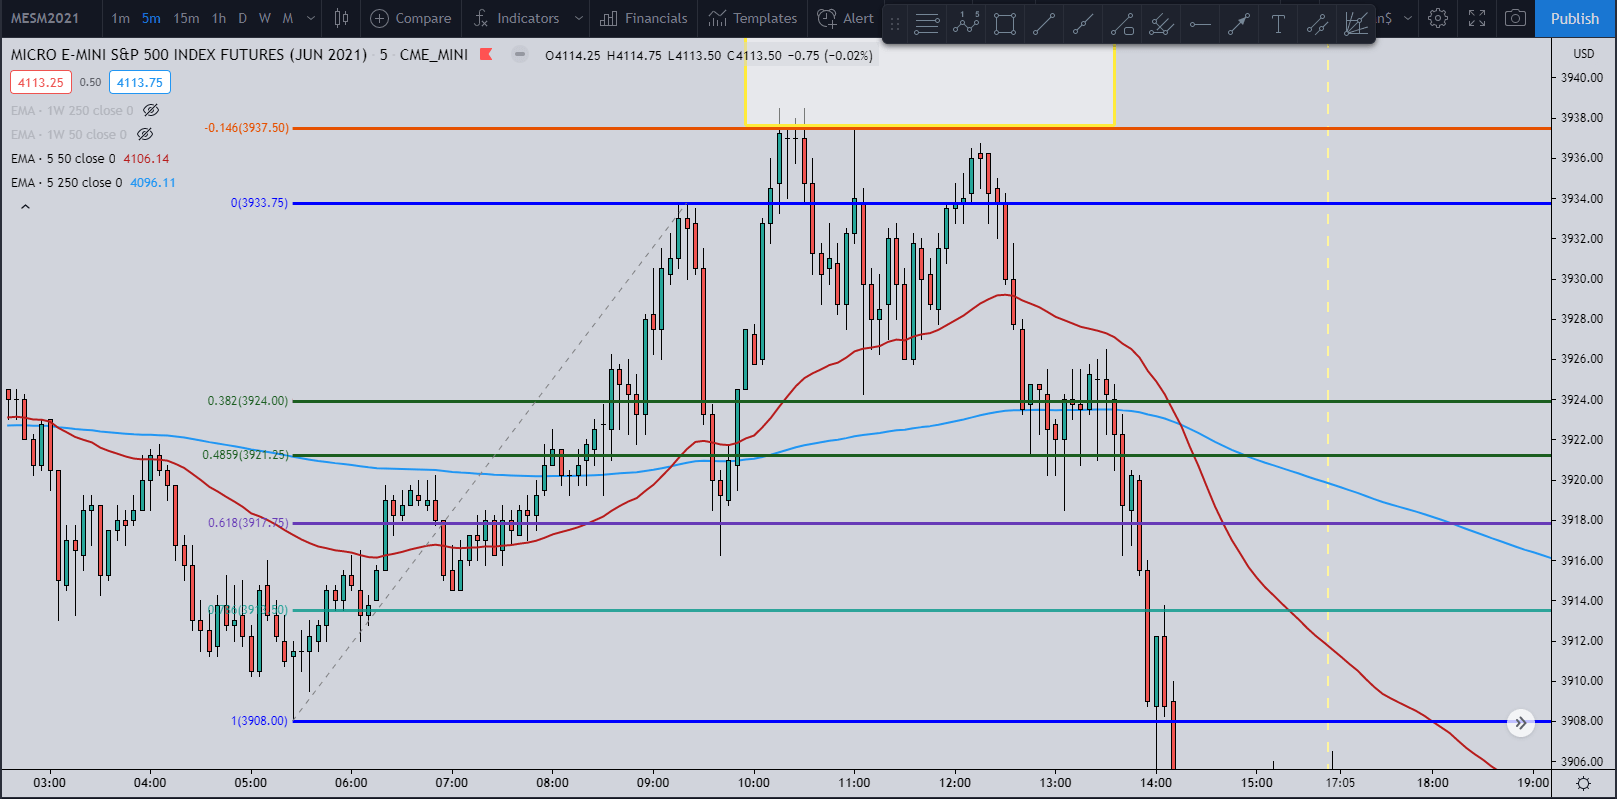
As you can see from this example the 78.6% Fibonacci retracement level did not get hit. But I added the 61.8% level (the purple line) to show you that was the level the price bounced off of to go and then hit the 1.416% target at 3937.50 (the orange line with the yellow box).
The 61.8% line is perfectly valid to use as well. Pretty much any retracement level that you would want to use is valid. You just have to find what works for you.
Video of the Moving Average Crossover Trading Strategy
In the video, I also cover the 23.6% Fibonacci retracement level because it is one to consider if you are looking at using this trading setup. It can make the difference between winning and losing a trade but it can also make you miss on winning trades as I show in the video. Just something to consider.
Conclusion
One thing to remember is that this setup does not work 100% of the time. I do believe the suggestion I recommend that it does give you a much better chance of success, but again, it will not be 100%.
You might even be able to make further modifications to it that have it work even better for you. But this is how I have used the moving average crossover strategy in my trading for both futures and stocks.
The way I like to trade is to look for retracement levels or extreme extension levels depending on the setup. But what this crossover strategy does to help is it does assist in getting you trading in the direction of the trend by waiting for the crossover to happen.
You can use just about any moving averages you like to use and change it up to what suits your trading style. But with this framework in place then I hope it shed light on a new tool you could potentially use in your trading toolbox.
Here are other articles regarding the Moving Average Crossover:
- Using Moving Average Crossover to Enter and Exit Trades: https://howtotrade.com/courses/moving-averages-in-forex/moving-average-crossover/#:~:text=What%20is%20a%20Moving%20Average,Simple%20as%20that!
-
How to Use a Moving Average to Buy Stocks: https://www.investopedia.com/articles/active-trading/052014/how-use-moving-average-buy-stocks.asp
P.S. – I recently wrote an article about the SMA vs EMA that is a very nice compliment to this article: https://evancarthey.com/sma-vs-ema-a-comprehensive-comparison-strengths-and-weaknesses/


