Boost Your Trading With Money Flow Index Indicator – Here’s How
The Money Flow Index Indicator can help with the two questions below.
- Are you looking to improve your trading performance?
- Have you been searching for an indicator that is easy to read and can help spot turning points?
When I trade I want a chart that is clean and easy to read. I don’t want to have to search for divergences using a microscope. I definitely don’t want to have to squint my eyes to see if the indicator is telling me if the market is overbought or oversold.
There are many indicators out there but at this current time, one of my favorite ones is the Money Flow Index Indicator (MFI). It is easy to read and shows you clearly if the market is overbought or oversold.
The MFI does this by analyzing the volume and price of an asset and can provide insights into whether the asset is oversold or overbought.
I will show you in this article how the MFI indicator can be used as a helpful trading tool. I have not found a way to use it by itself in order to make accurate trades. It will help show you if the market could be getting ready to turn around at a certain level.
Verify then trust
No indicator is right 100% of the time and the Money Flow Index Indicator is no different.
I’ve tested this indicator out and it seems to work for me. Please test this indicator out just like any other indicator.
Make it prove to you that it passes your tests and is worthy enough to be included in your trading arsenal.
I like to view indicators as building blocks that help increase your chances of being a profitable trader. Indicators by themselves are worthless. But if you tweak them to fit your trading style and setups then they can help guide you to better trading decisions.

In my opinion, I think the MFI is superior to other more popular indicators such as the RSI and MACD. It is easier to read and doesn’t give as many false signals. But that is my opinion so the way you trade may be completely different and you prefer other indicators over the MFI, and that is perfectly fine.
No two trading styles will be exactly the same. You have to find out what works and what doesn’t work for you and how you trade.
But with this information, you can make more informed trading decisions and potentially increase your profits.
What is the Money Flow Index Indicator?
The Money Flow Index (MFI) is a technical indicator that measures the buying and selling pressure of an asset. It is used by traders to identify potential trend reversals and to confirm price trends.
How is it calculated?
The MFI is calculated by combining price and volume data.
The formula takes into account the typical price for a certain period, the volume traded, and the direction of the price movement.
The resulting value is then normalized to a range between 0 and 100.
What does it measure?
The MFI measures the flow of money into and out of an asset. It helps traders to identify overbought and oversold conditions, as well as potential trend reversals.
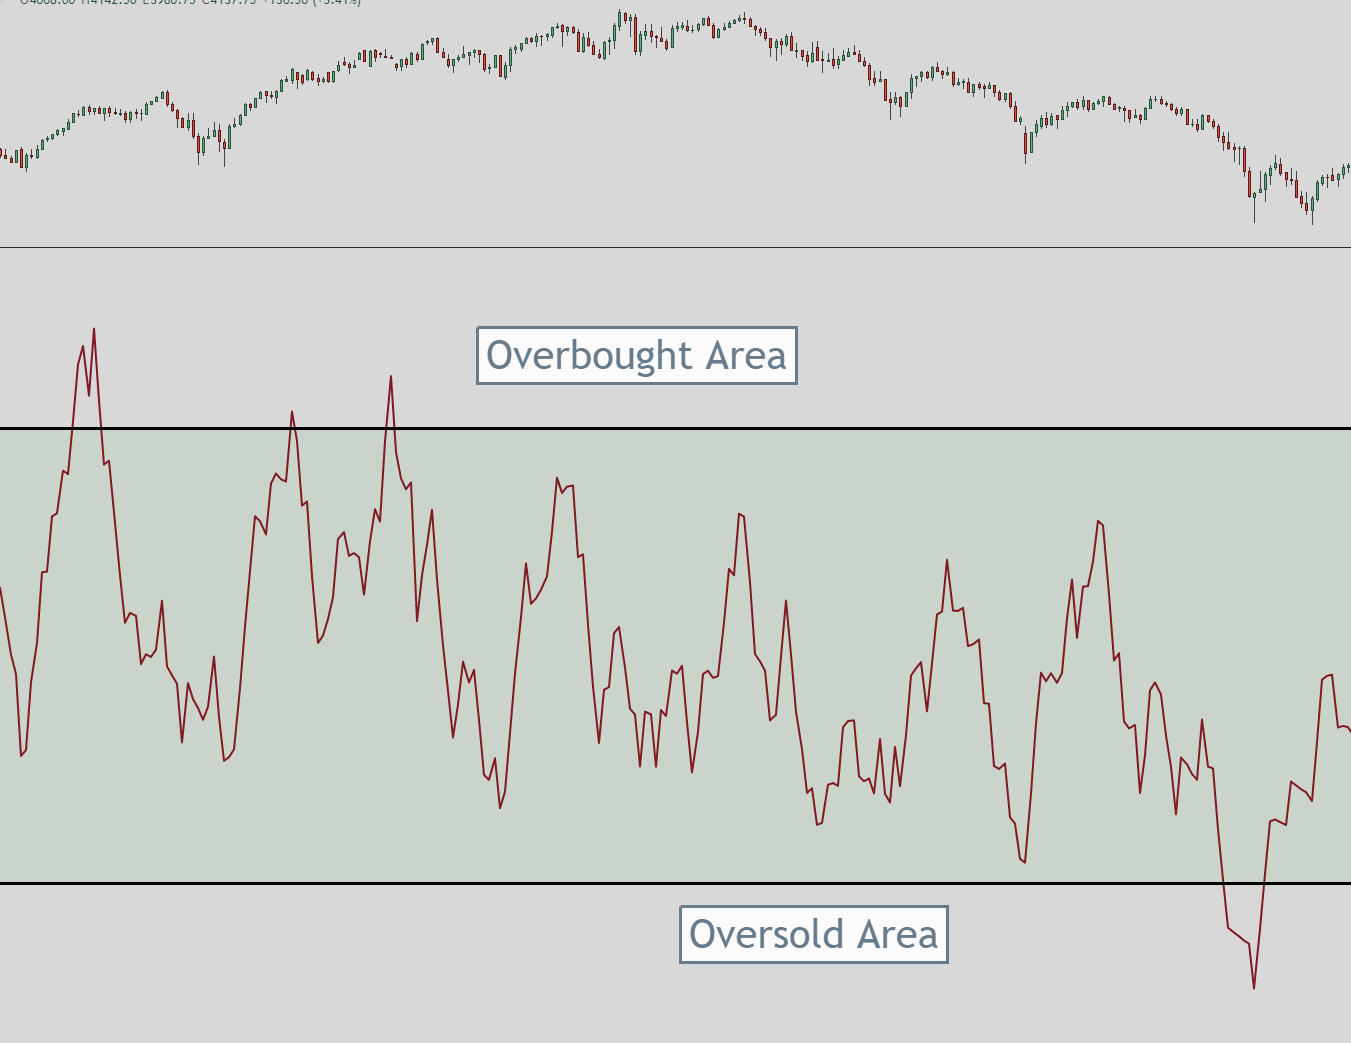
The two main areas I focus on are the 80 and 20 areas.
A reading above 80 is considered overbought, while a reading below 20 is considered oversold. Traders can use these levels to determine when to enter or exit a position.
When the MFI is above 80 then we should be looking for the market to retrace, pull back or sell off.
If the MFI is below 20 then we should be looking for the market to rebound or move up.
The MFI can also be used to confirm price trends. When the MFI is trending in the same direction as the price, it is a sign that the trend is strong and likely to continue.
Conversely, when the MFI is trending in the opposite direction of the price, it is a sign that the trend may be weakening and a reversal could be imminent.
Overall, the MFI is a useful tool for traders looking to identify potential trend reversals and confirm price trends.
Traders should combine it with other forms of analysis and avoid using it in isolation to make informed trading decisions, as with all technical indicators.
Video
How to Use the Money Flow Index Indicator
Interpreting the Indicator
To use the Money Flow Index (MFI) indicator, you need to understand how to interpret it.
The MFI is a momentum indicator that measures the inflow and outflow of money in a security over a specific period.
It ranges from 0 to 100, with overbought conditions above 80 and oversold conditions below 20. When the MFI is above 80, it signals that the security is overbought, and traders may consider selling.
When the MFI falls below 20, it signals an oversold market, and traders may consider buying the security.
Common Trading Strategies Using the Money Flow Index
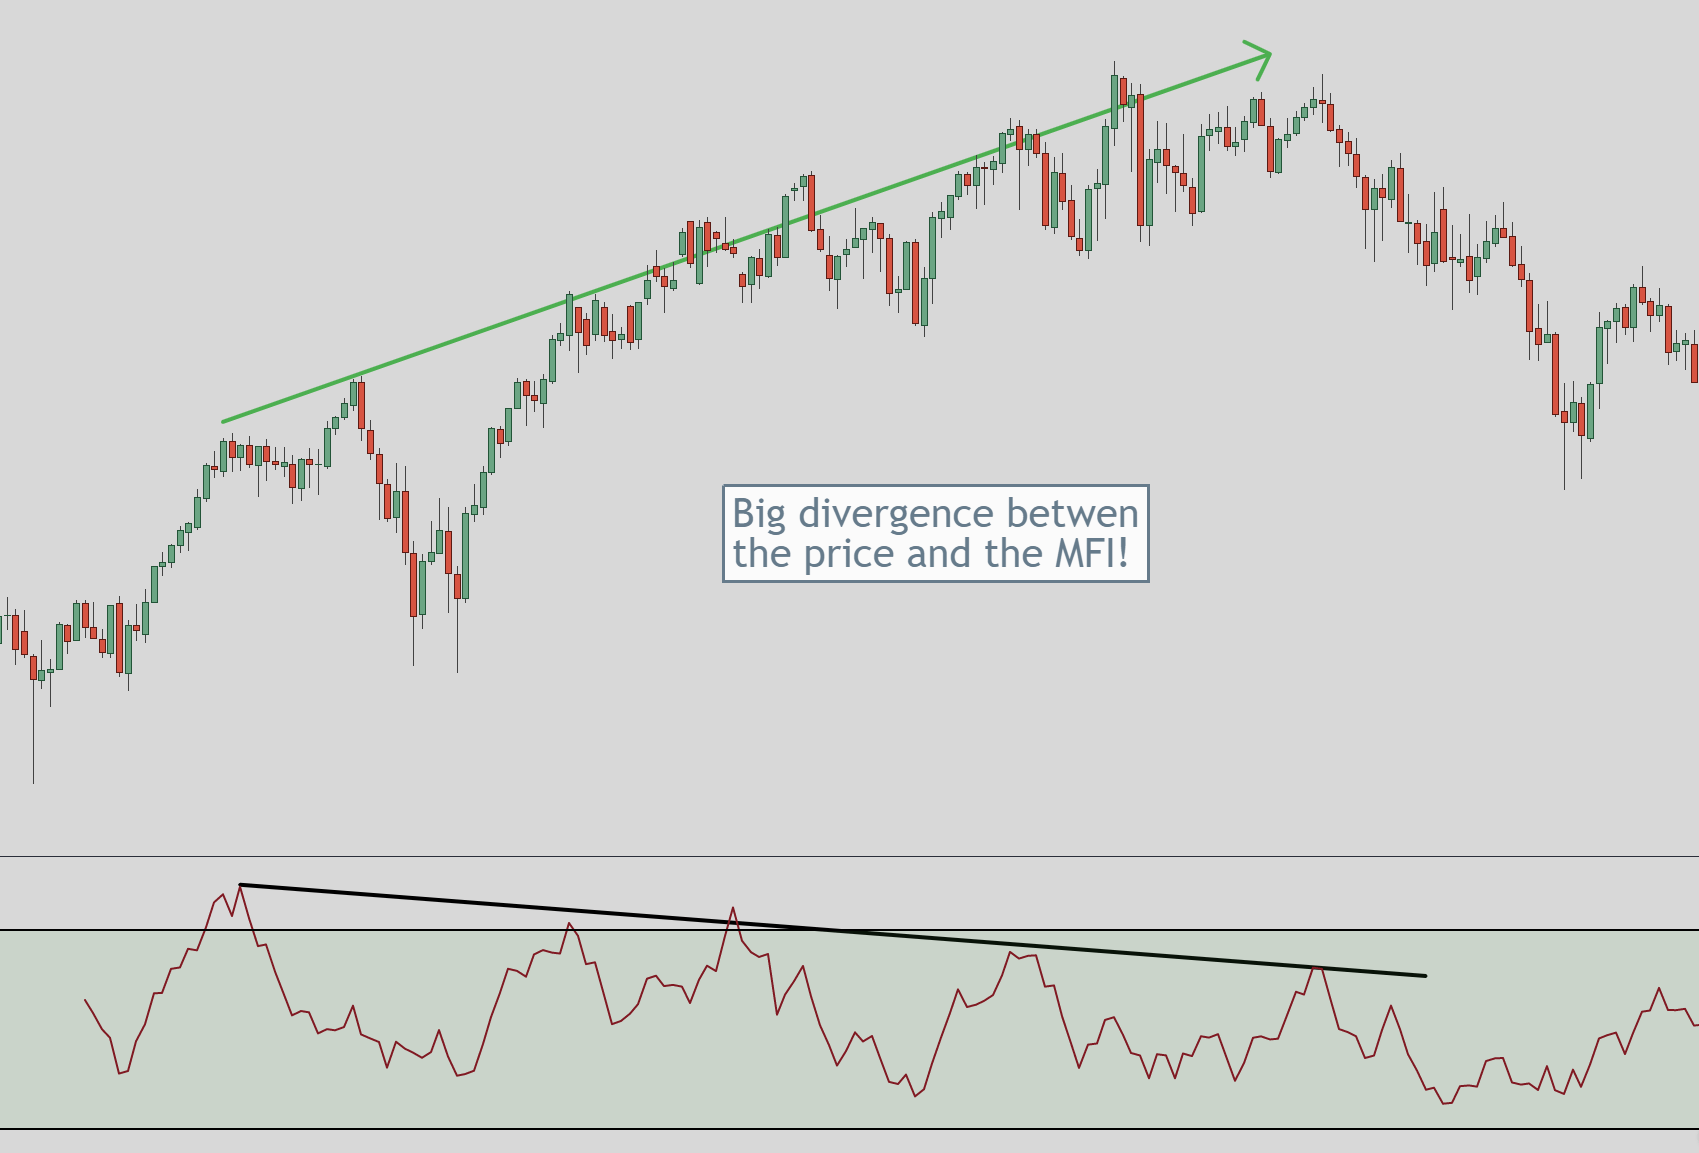
There are several trading strategies that traders can use with the MFI indicator. One popular strategy is to use divergence to identify potential trend reversals.
When the price of a security is making higher highs, but the MFI is making lower highs, it is a bearish divergence and may signal a trend reversal.
Conversely, when the price is making lower lows, but the MFI is making higher lows, it is a bullish divergence and may signal a trend reversal. Another strategy is to use the MFI as a confirmation indicator.
For example, if a security is in an uptrend, and the MFI is also rising, it confirms the trend and may signal a good time to buy. Conversely, if a security is in a downtrend, and the MFI is also falling, it confirms the trend and may signal a good time to sell.
Examples
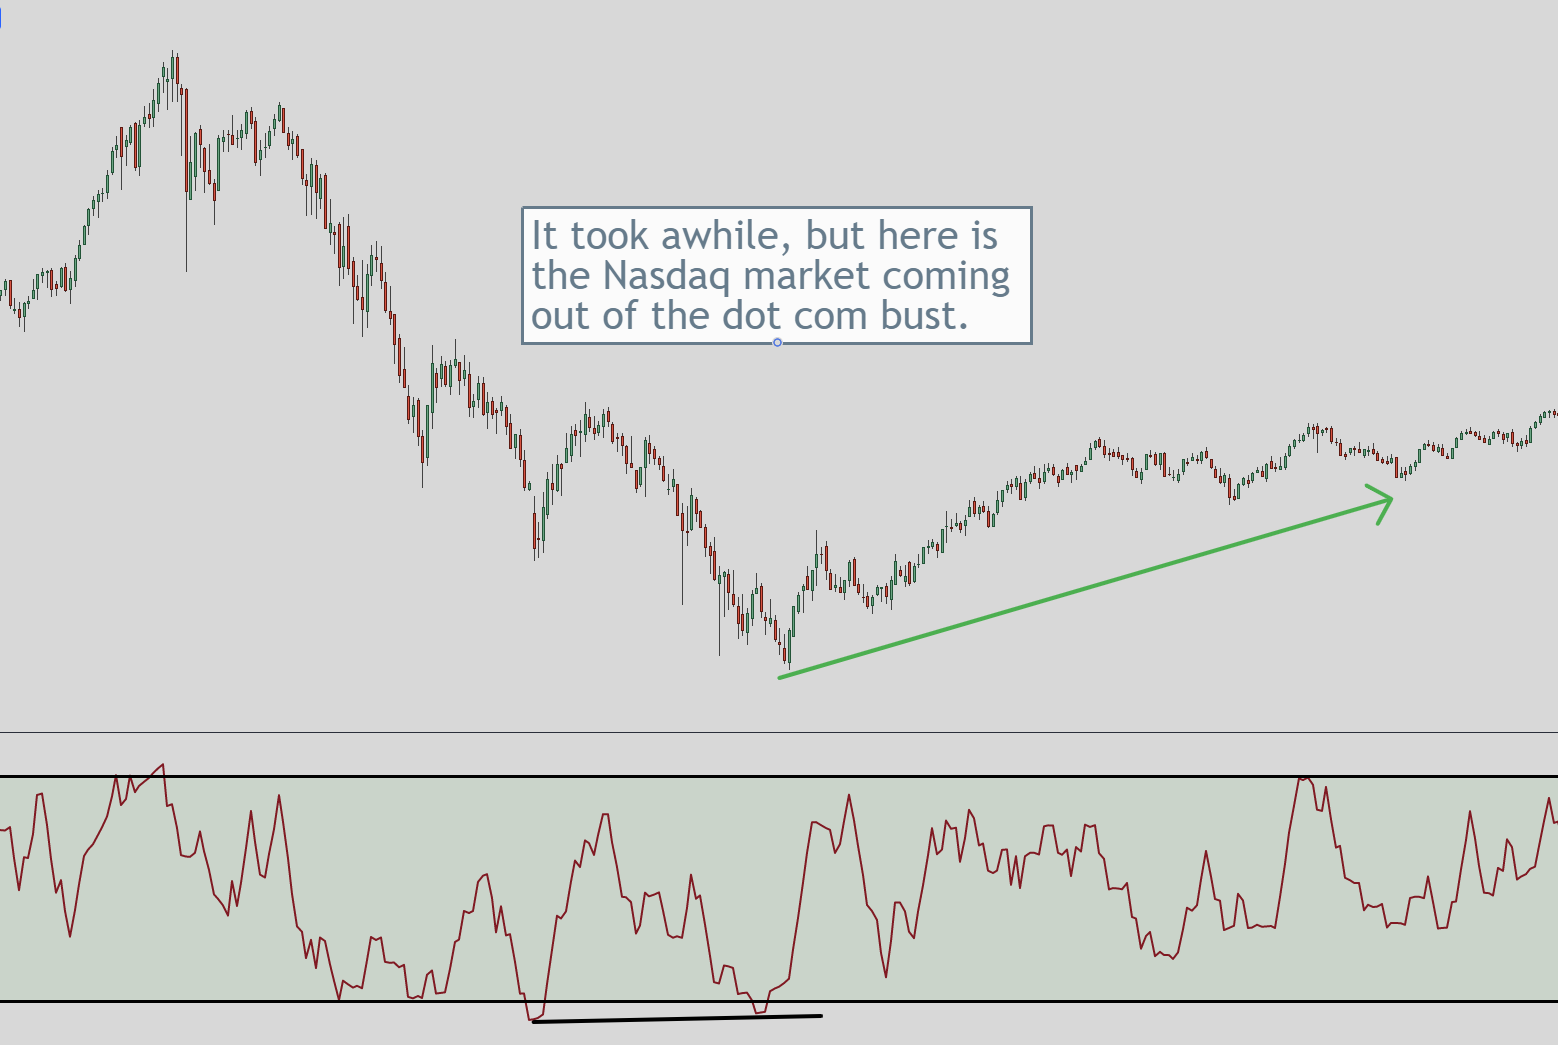
In the image above you can see that the Money Flow Index Indicator created a divergence. It had made higher lows while the price made higher highs.
So if you are looking to go long on a stock and the MFI is rising out of being below the 20 area then that will help confirm that the stock has the potential to move higher with more money through volume coming into it.
If you are looking to short a market then you would be looking for the MFI to be in or coming out of 80 area.
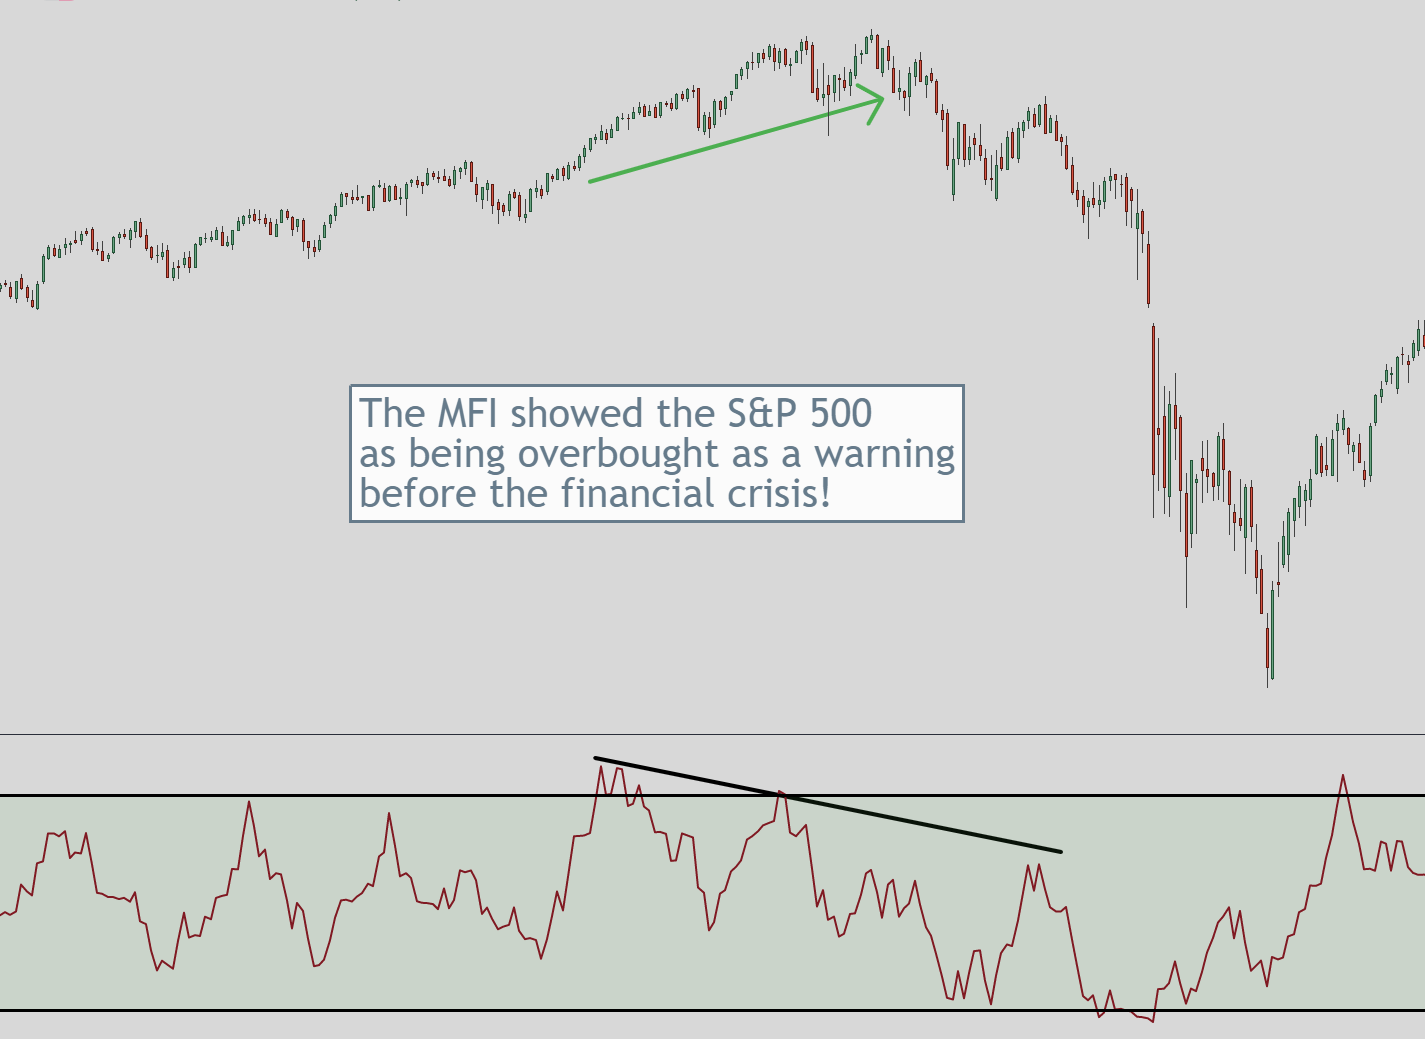
Before the financial crisis hit we can see in the image above that the MFI was showing an overbought level. The overbought level was declining but the market was still rising before it eventually crashed.
In summary, the MFI indicator can be a useful tool for traders to identify potential trend reversals and confirm trends. I’ve found it more useful than most other indicators.
Limitations of the Money Flow Index Indicator
If you are using the Money Flow Index (MFI) Indicator for trading, you should be aware of its limitations. Here are some of the limitations:
The MFI Indicator is not a standalone tool. Traders should use other technical indicators to confirm signals when using it. This is self-explanatory, you cannot use the MFI by itself to trade. You will lose money if you do.
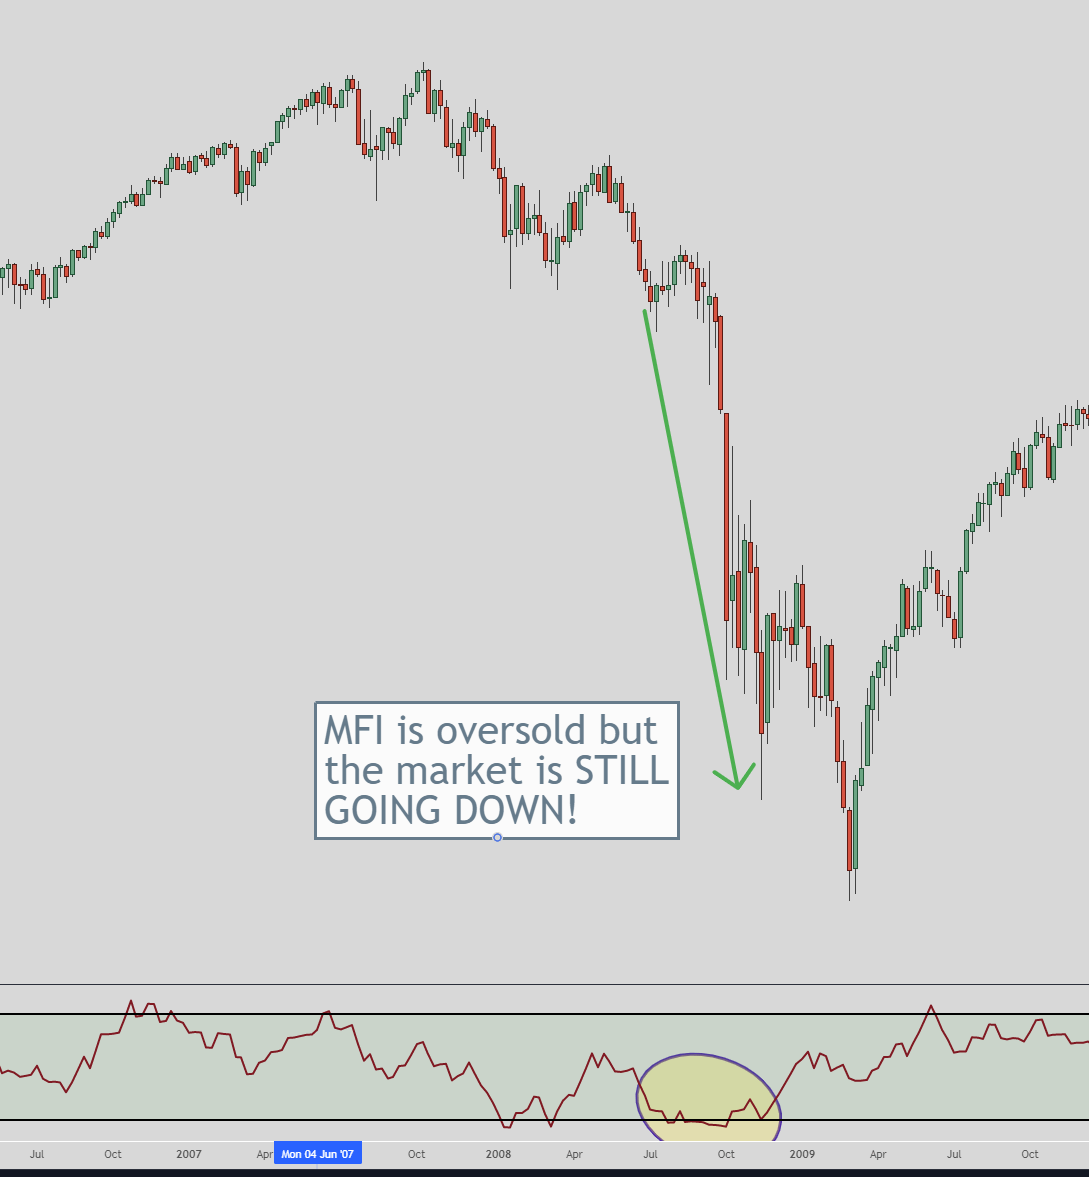
The MFI Indicator may also generate false signals in choppy or sideways markets. It may show oversold or overbought conditions such as the image above but the price doesn’t reverse.
Just like every other indicator, there will be times when it shows an overbought or oversold level but doesn’t turn around. The market keeps moving in that direction even though it is at an extreme.
Momentum not Timing
It’s not a timing indicator, it is a momentum indicator.
The MFI Indicator may lag behind price action, which means that it may not provide timely signals. It is a lagging indicator just like most other indicators so this means you must wait for the price to confirm before it updates the MFI.
The MFI Indicator may not work well in markets with low liquidity because most indicators don’t work well in markets with low liquidity (not groundbreaking news).
If you are trading low liquidity markets then you need to be careful for other reasons. Using the MFI indicator should be the least of your concerns. I’d be more worried about market manipulation.
It is important to keep these limitations in mind when using the MFI Indicator for trading. Always use the MFI Indicator in combination with other technical indicators and analyze the market conditions before making any trading decisions.
The two big points to remember:
- It is a momentum-focused indicator, not a timing indicator that predicts exactly when the market will turn.
- The MFI is a lagging indicator so it only forms after the price has formed. It does not predict the price.
Conclusion to the Money Flow Index Indicator
You now know what the Money Flow Index (MFI) is and how you can use it. By analyzing money flow in and out of a security, the MFI can help you identify potential trend reversals and overbought/oversold conditions.
Remember, the MFI is just one tool in your trading arsenal. To make informed trading decisions, traders should use it in conjunction with other indicators and analysis techniques. This is just one piece of the puzzle.
Always practice proper risk management and never rely solely on one indicator.
As with any trading strategy, there is no guarantee of success. The MFI is not a crystal ball and cannot predict the future. However, when used correctly, it can help you make more informed trading decisions and increase your chances of success.
I’ve found it to be extremely useful when I am looking to get into a market.
I have refrained from taking long positions based on the MFI’s indication of an overbought market. Similarly, I have avoided selling a market when the Money Flow Index indicator indicated an oversold market
Due to that, I waited for a pullback to get in at a better price. Little things like that add up over time and help your trading account grow.
Here are further articles if you wish to read more about the Money Flow Index Indicator:
- The Money Flow index – MFI Definition and Uses: https://www.investopedia.com/terms/m/mfi.asp
- Money Flow Index (MFI): https://www.fidelity.com/learning-center/trading-investing/technical-analysis/technical-indicator-guide/MFI
- Money Flow Index (MFI): https://school.stockcharts.com/doku.php?id=technical_indicators:money_flow_index_mfi

