SMA vs EMA: A Comprehensive Comparison of Strengths and Weaknesses
Both the SMA vs EMA will be the focus of this article. Those are the abrevieations for the simple and exponential moving averages.
When it comes to analyzing financial data, moving averages are one of the most popular tools used by traders. They help to smooth out price fluctuations and identify trends, making it easier to make informed trading decisions.
Two of the most commonly used types of moving averages are the simple moving average (SMA) and the exponential moving average (EMA). Both the SMA vs EMA will be the focus of this article.
The main difference between the two types of moving averages is the way they are calculated. First, the SMA is calculated by taking the average of a set number of prices over a specific period of time. For example, a 50-day SMA would take the average of the closing prices for the past 50 days.
The EMA, on the other hand, gives more weight to recent prices, making it more responsive to changes in the market. This means that the EMA may be more useful for short-term trading, while the SMA may be better suited for longer-term analysis.
While both types of moving averages have their strengths and weaknesses, the choice between the two ultimately depends on the trader’s individual goals and preferences. The SMA is a popular choice for traders who prefer a simple and straightforward approach to analyzing the market.
It can be useful for identifying long-term trends and can be less prone to false signals. However, the EMA may be better suited for traders who want to be more responsive to short-term changes in the market. It can be more sensitive to price fluctuations and can help traders identify potential trading opportunities more quickly.
What is SMA?
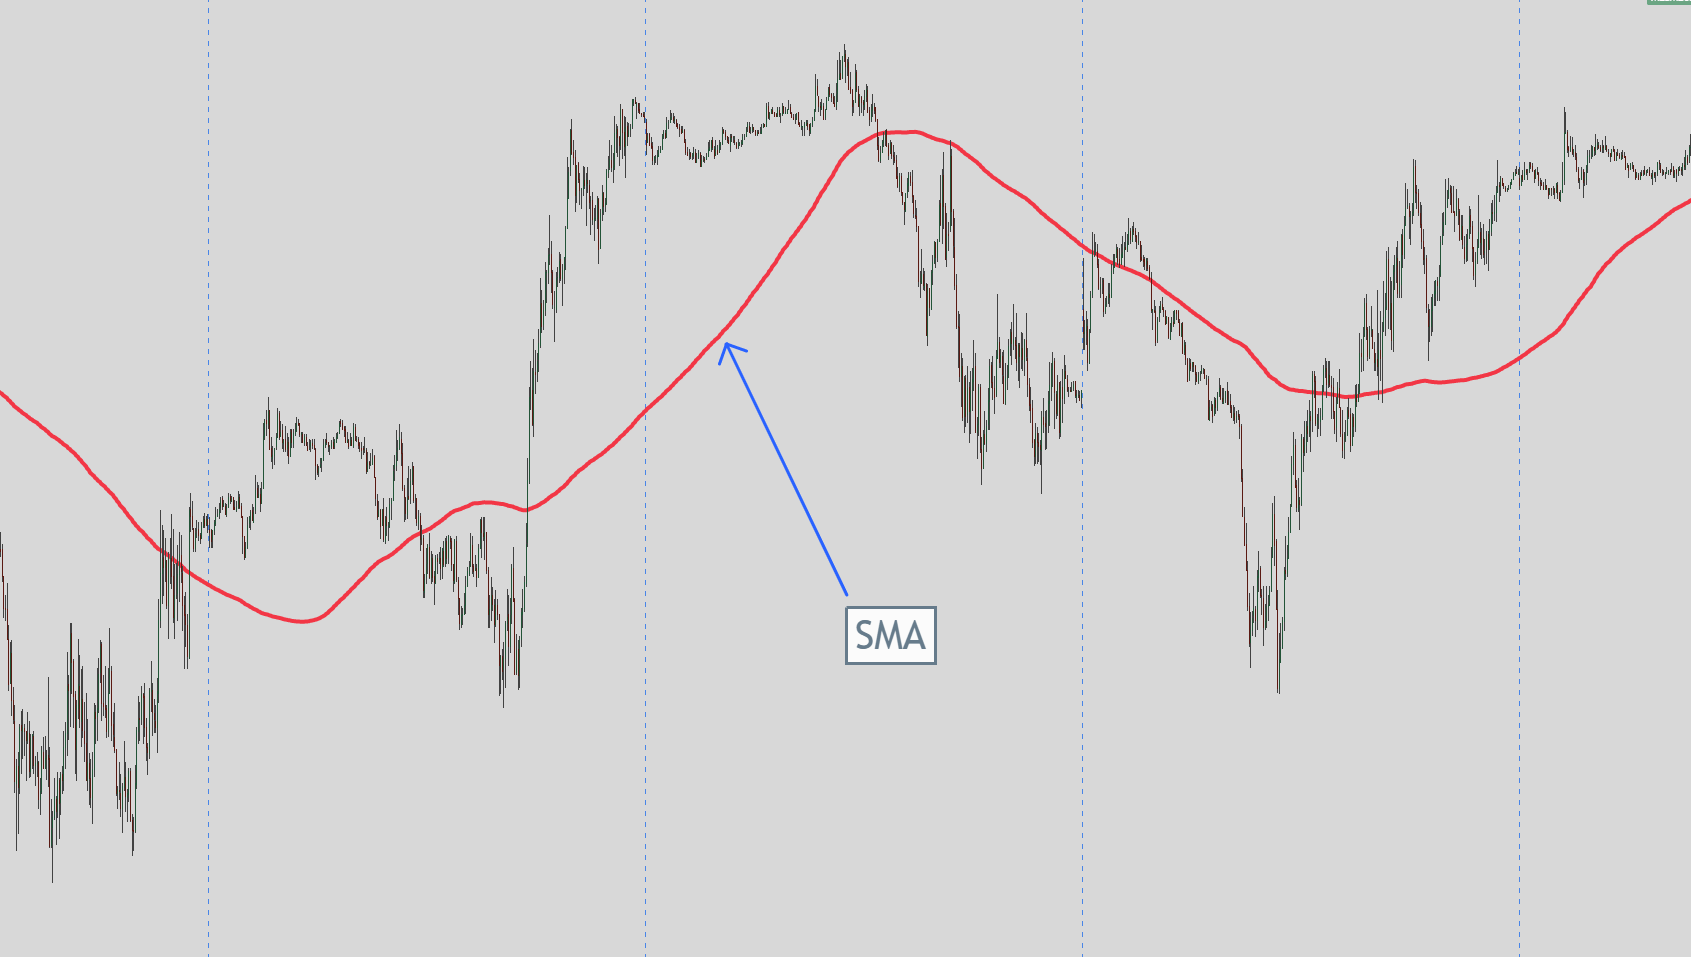 Simple Moving Average
Simple Moving Average (SMA) is a technical analysis tool used to smooth out price data by calculating the average price of an asset over a specified time period. Traders and investors commonly use SMA more than any other moving average.
Strengths of SMA
- SMA is easy to calculate and understand.
- It is a reliable indicator of trends over a specific time frame.
- The SMA is useful for identifying support and resistance levels.
- It is less sensitive to price volatility than EMA.
Weaknesses of SMA
- SMA is slower to respond to recent price changes than EMA.
- It can generate false signals during periods of high volatility.
- The SMA does not give more weight to recent prices.
- It is not suitable for short-term trading.
Overall, SMA is a useful tool for traders and investors who want to identify trends over a specific time frame. However, it is important to understand its limitations and use it in combination with other technical analysis tools to make informed trading decisions.
Since the SMA is a lagging indicator, it confirms the price only after it has been calculated. It tells you the average of where the price has been on the chart depending on the input for the level of time frame you tell it to use.
What is EMA?
An Exponential Moving Average (EMA) is a type of Moving Average (MA) that places a greater weight and significance on the most recent data points. This is achieved by applying more weight to data that is more current.
The EMA is similar to the Simple Moving Average (SMA) but is more reactive to near-term price swings. It allows for smoothing out price changes to see the overall trend in price.
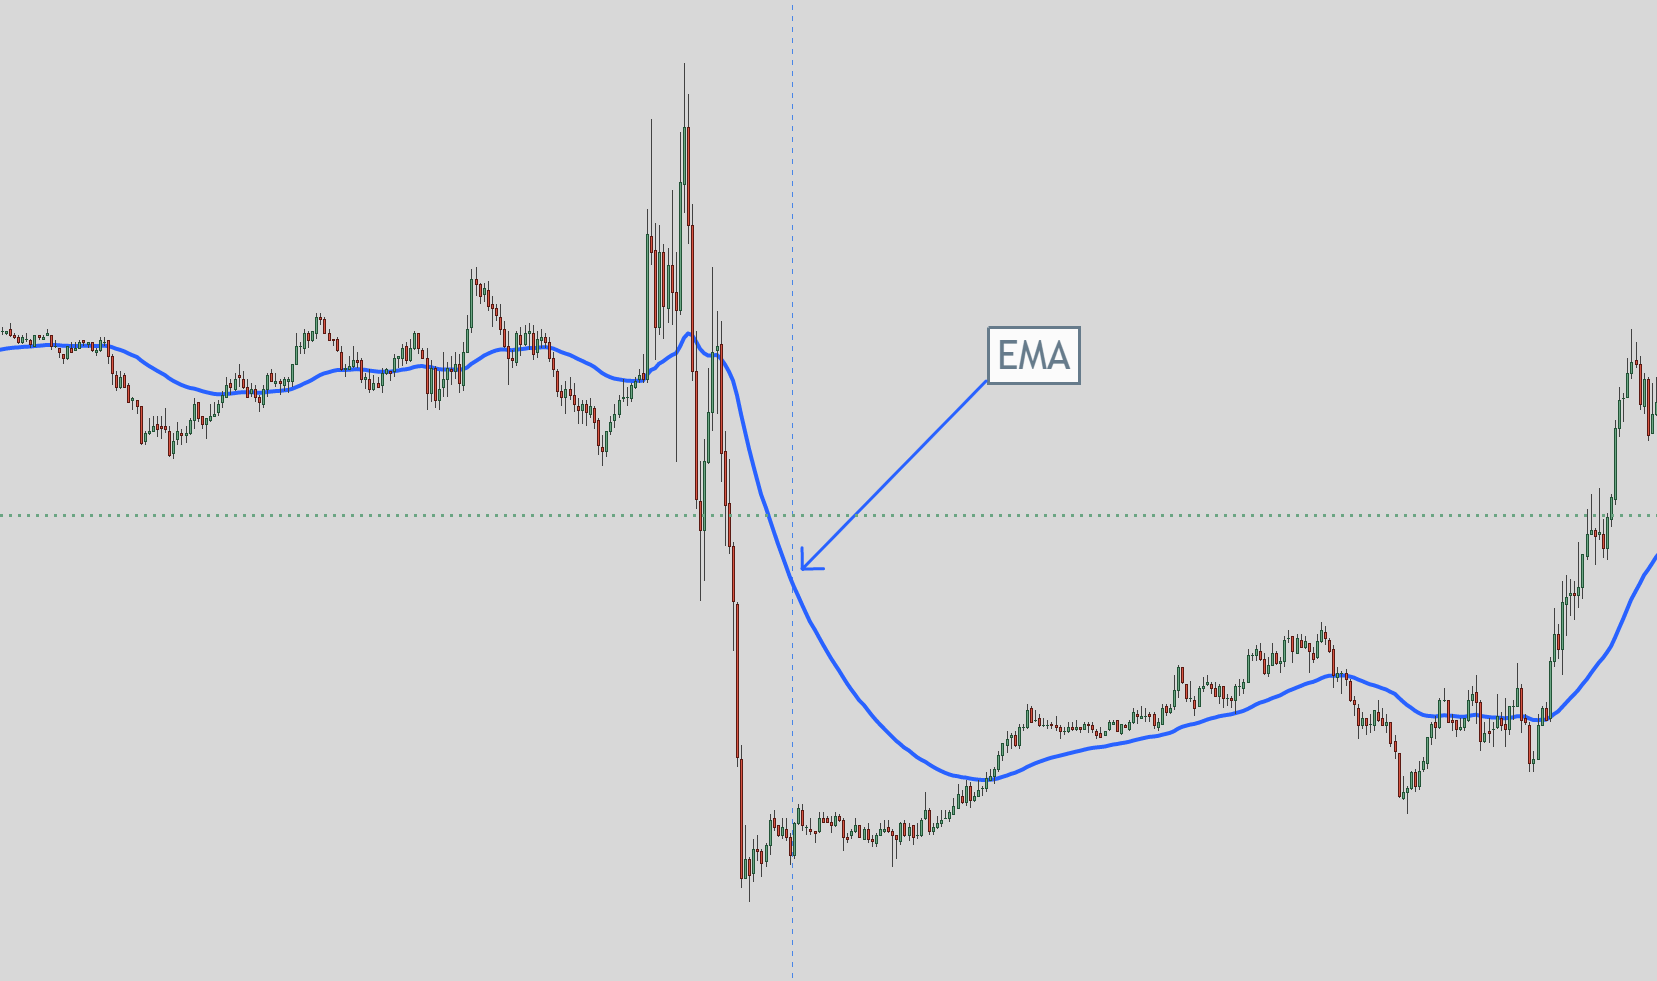 EMA
EMA
Strengths of EMA
EMA or exponential moving average is a type of moving average that gives more weightage to recent price data, making it more responsive to current market trends. It is a popular technical analysis tool used by traders to identify potential entry and exit points in the market. Here are some strengths of EMA:
- The EMA is more responsive to current market trends compared to SMA, making it useful for short-term traders.
- It is a good indicator of the current market sentiment and can help traders identify potential trend reversals.
- EMA is easy to calculate and can be used alongside other technical indicators to confirm trading signals.
Weaknesses of EMA
While EMA has its strengths, it also has some weaknesses that traders should be aware of:
- The EMA can be more volatile compared to SMA, which can lead to false trading signals.
- It is not as useful for long-term traders as SMA, which gives more weightage to historical price data.
- EMA is more complex to calculate compared to SMA, which can make it harder for novice traders to use.
Just like the SMA, the EMA is a lagging indicator so you cannot use it to predict where the price is going on a chart. It is used to show you where the average of price has been depending on the time frame you use to input into the EMA.
The Differences between the SMA vs EMA
When it comes to trading, moving averages are an important tool to analyze trends and make informed decisions.
In this section, we will discuss the differences between SMA and EMA, the advantages of each, and when to use them.
The primary difference between SMA and EMA is the way they calculate the average price of an asset over a certain period. SMA calculates the average price by adding up the prices over a set number of periods and dividing them by that number.
EMA, on the other hand, gives more weight to recent prices, making it more responsive to price changes in the short term. This means that EMA is more sensitive to price changes than SMA.
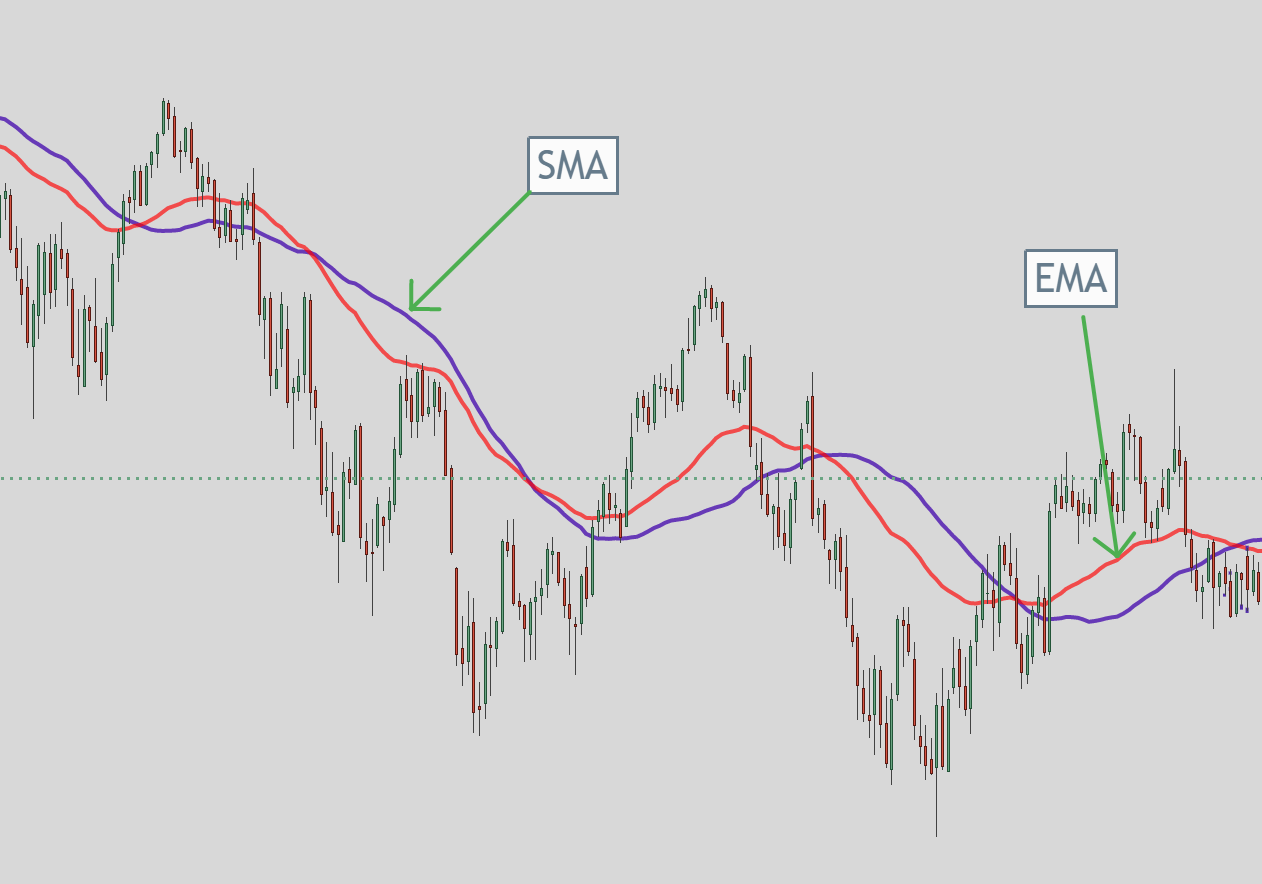
The picture above shows that we used the 200-moving average input. This shows how the EMA plots differently than the SMA. The SMA is the blue line and the EMA is the red line.
Advantages of Each Moving Average
- The SMA is simpler and easier to understand than EMA.
- It is more stable and less volatile than EMA, making it better suited for identifying long-term trends.
- The SMA is better at filtering out noise and false signals, making it more reliable for trading.
- The EMA is more responsive to price changes in the short term, making it better suited for identifying short-term trends.
- It is more accurate than SMA when it comes to predicting future price movements.
- The EMA is better suited for fast-moving markets, where price changes can occur rapidly.
When to use SMA and EMA
Traders and investors can best use SMA to identify long-term trends and filter out the noise and false signals.
It is also useful for traders who prefer a more stable and less volatile approach to trading.
For the EMA it can best be used to identify short-term trends and predict future price movements.
It is also useful for traders who prefer a more responsive and accurate approach to trading.
Trading Strategies using the EMA or SMA
The two main ways traders use moving averages to trade are either a crossover trading strategy or a retracement trading strategy.
I’ll show examples of each and I also covered them in the video above. I wrote about another way to use a crossover trading strategy using moving averages that you can read about here: https://evancarthey.com/moving-average-crossover-trading-strategy/
I am a day trader and a swing trader. So should I use the EMA or SMA for swing trading?
I prefer the EMA. The reason why is that I trade on 5-minute charts to 15-minute charts for my day trades which sometimes end up being swing trades if I hold them overnight.
The EMA as mentioned above is a little better suited for shorter-term trades than the SMA.
Plus, when I switch over to hourly, daily, and weekly timeframe charts I don’t want to have to switch from the EMA to the SMA. I try to keep everything as simple as possible so I don’t bother switching over from the EMA to the SMA.
Moving Average Crossover Trading Strategy for the SMA vs EMA
With the moving average crossover trading strategy, one of the most popular strategies is the Golden Crossover Strategy.
With this strategy, you will use a 50-day moving average and a 200-day moving average. When the 50-day moving average crosses the 200-day moving average then you enter the trade. In the examples below we will be using the EMA. The red line is the 50 and the blue line is the 200 moving average.
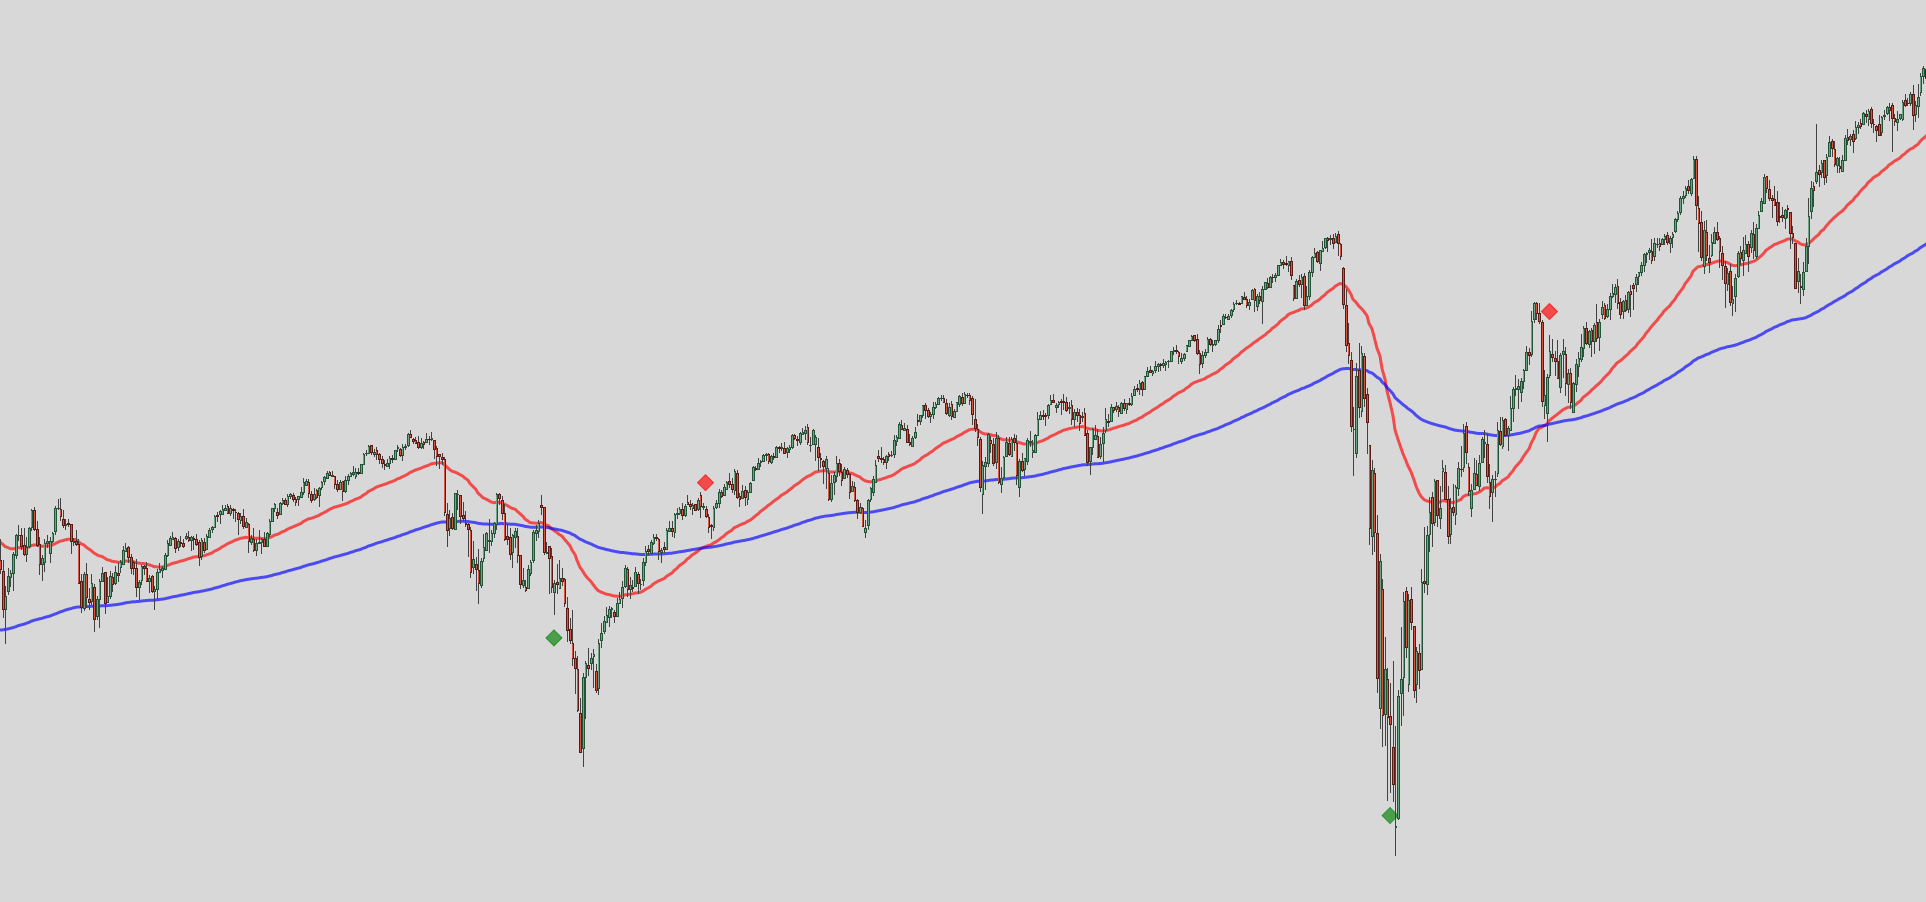 Golden Cross
In the picture above the green diamond represents a golden cross sell signal. The red diamond represents a golden cross buy signal. You can see where the red line crossed over the blue line which is a golden cross signal.
To exit the trade once you enter there are two main options. The first option is when the price retraces back to the 200-day moving average which you can see in the image below.
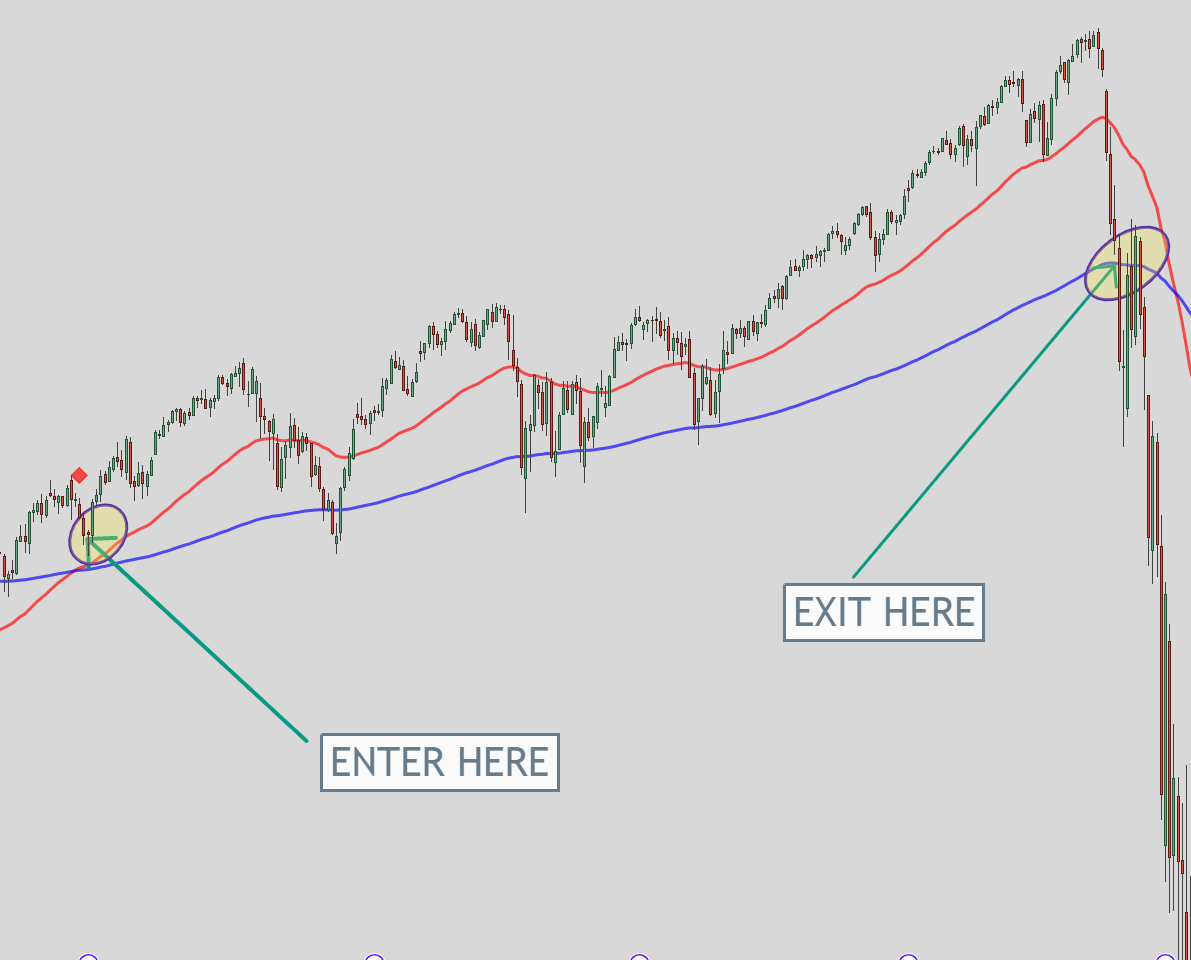 Golden Cross entry and exit using 200 ma retracement
Another Exit Idea
The second exit idea is when the 50-day moving average crosses the 200-day moving average going the other way as you can see from the image below. So you’ll have a golden cross signal going in the opposite direction.
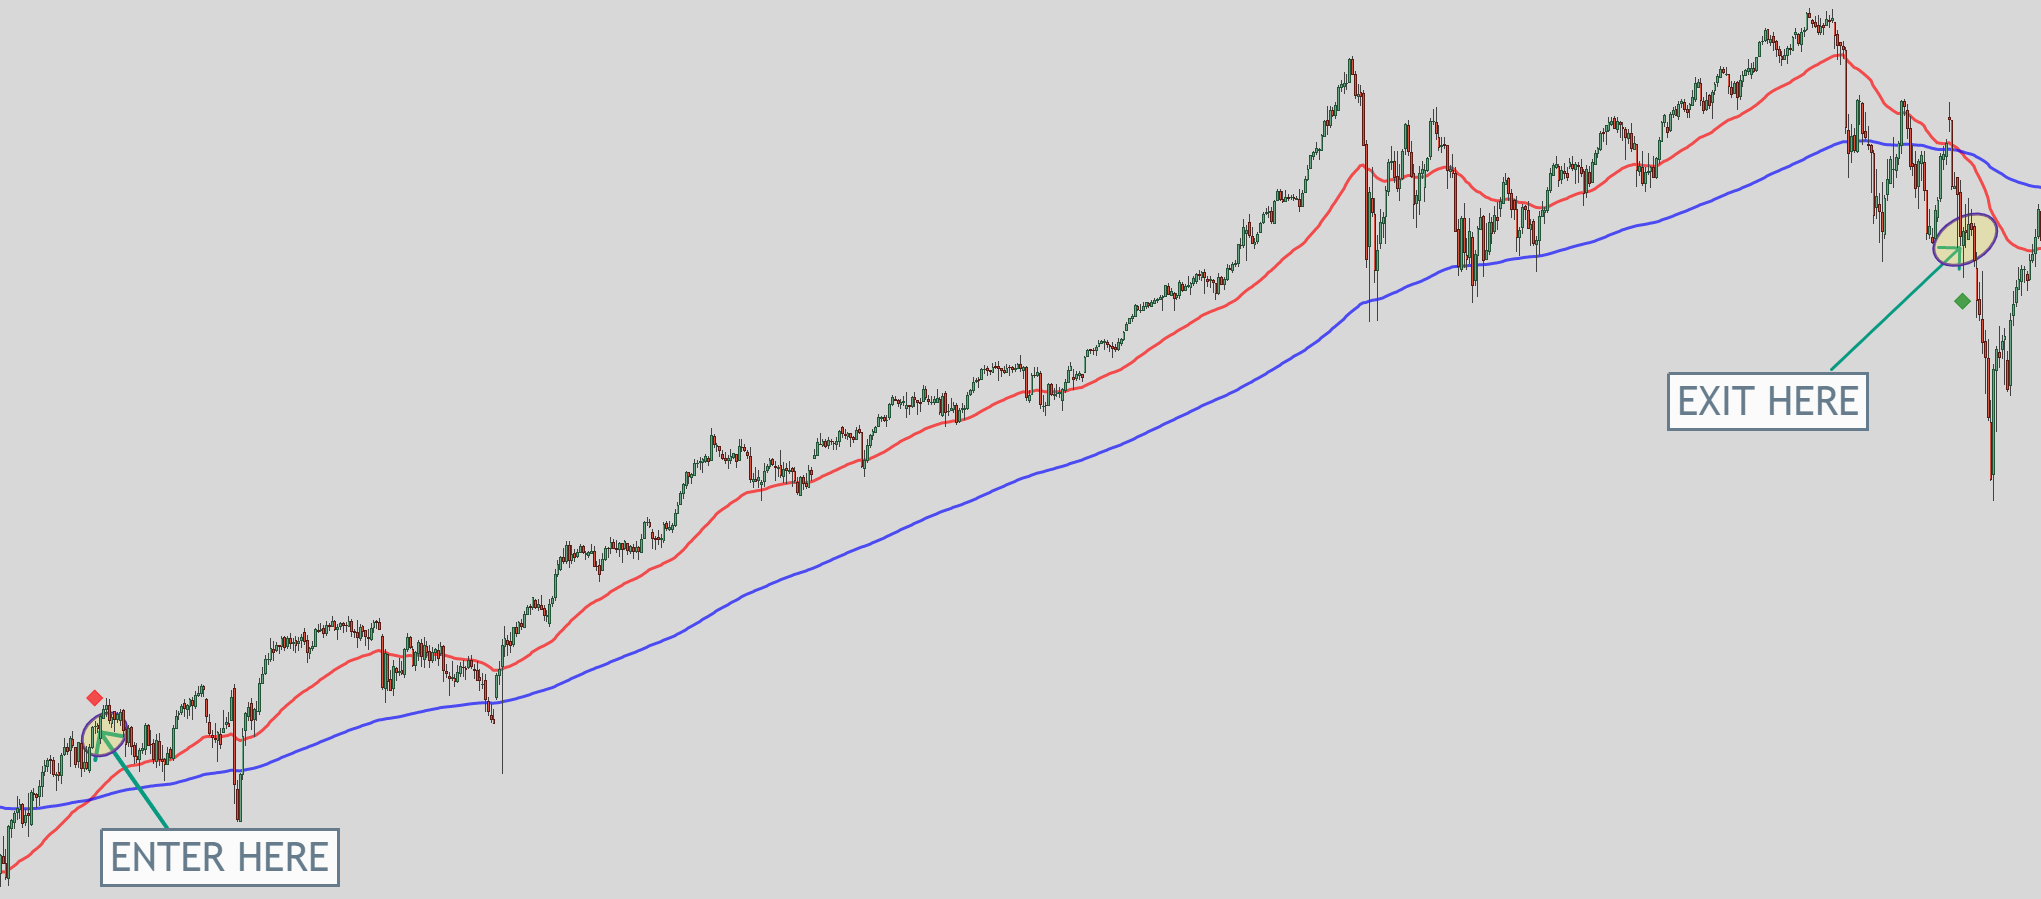 Golden Cross exit using the cross the other way
If you catch a big move then the Golden Crossover Strategy can identify big winners.
But the big drawback to this strategy is that it cannot differentiate between a trending market and a range-bound market. In the previous images, I cherry-picked winning trades that utilized the golden cross trading strategy.
If you are in a range-bound market then you will generate many losses in a row while you wait for a breakout to happen. The reason why is that you will get many Golden Crossovers before a big move happens as you can see from the image below.
The back-and-forth action could drain your trading account. Especially if you took every golden cross trade without filtering them out.
This would be such as identifying if the price action could be at the beginning of a trend. Here is an article I wrote about a way you can use to easily identify the trend in any market: https://evancarthey.com/trend-trading-a-new-and-easy-way-to-spot-the-trend-in-any-market/
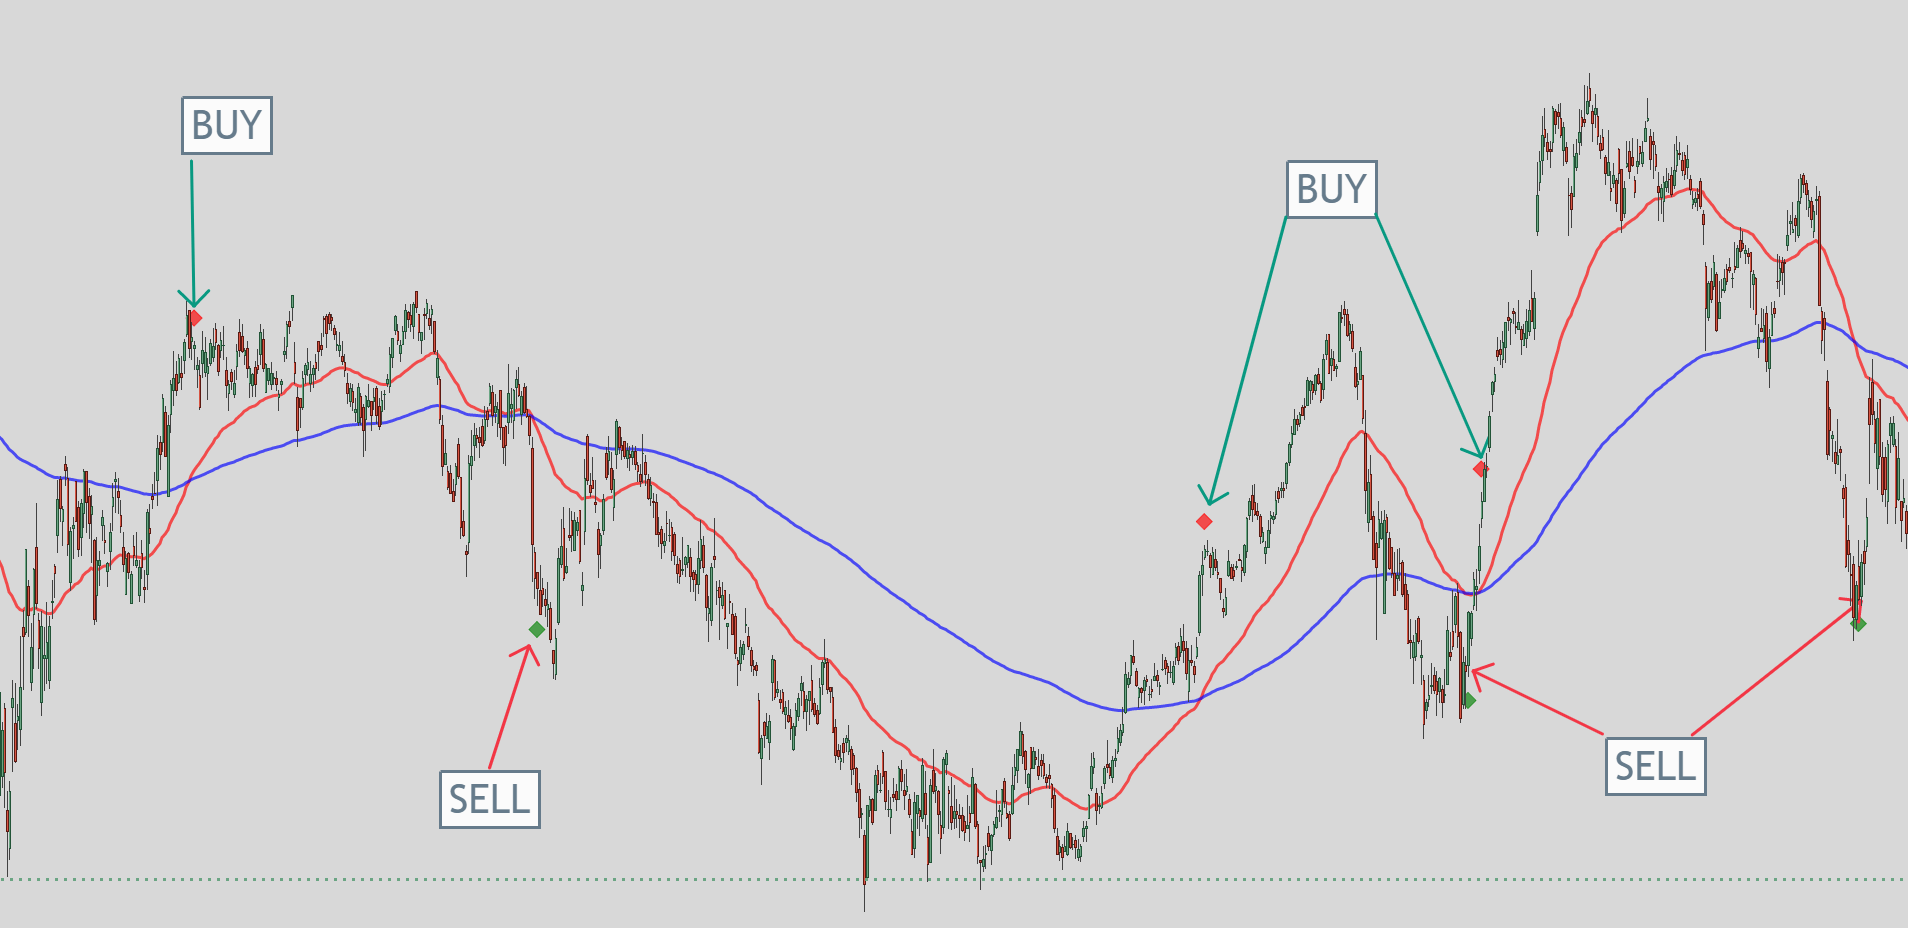 Range-bound market with lots of golden cross signals in sma vs ema.
If you would like a more in-depth article regarding the Golden Crossover Trading Strategy then you can read about it here: (COMING SOON)
Conclusion of SMA vs EMA
Both Simple Moving Average (SMA) and Exponential Moving Average (EMA) are popular tools in technical analysis for traders. Each has its own strengths and weaknesses, and which one to use for a given trade will depend on the trader’s strategy.
You are probably asking yourself between the SMA vs EMA which is better for me to use?
Here is a summary of the main strengths and weaknesses of each:
| SMA | EMA |
|---|---|
| Simple to calculate and understand | More responsive to recent price changes |
| Less sensitive to short-term price fluctuations | Can potentially provide better signals in trending markets |
| May lag behind in fast-moving markets | Can be more volatile and prone to false signals |
Traders who prefer a smoother, less volatile indicator may prefer the SMA, while those who prioritize recent price changes and are willing to accept more volatility may prefer the EMA.
Ultimately, the choice between SMA and EMA depends on the trader’s individual strategy, risk tolerance, and preference for different types of signals.
It is important to note that no moving average is perfect, and traders should always use other strategies to confirm signals and avoid false signals.
Here is another article about the SMA vs EMA:
- “Understanding Exponential Moving Average vs Simple Moving Average:” – https://www.investopedia.com/ask/answers/difference-between-simple-exponential-moving-average/

