Trend trading is easy to do in theory and even easier after the fact. This post will show you how I easily use Fibonacci extensions to spot the trend. In most trading videos or books it is all about drawing trend lines. I am not anti-trend lines but they do not work for me the way most people draw them. There is one book I recommend for drawing trend lines if you are starting out, it is called Stikky Stock Charts. It is very simple, interactive, and easy to read. Also, it is extremely cheap which is another bonus.
For years I tried and tried to try and draw the perfect trend line but after all those years I only discovered on thing: trend line drawing is extremely subjective and depends upon the person drawing them. In my trading, I am always looking to remove as much subjectivity to my trading as possible which is why I love using Fibonacci extensions and Fibonacci retracements. They provide structure and guidelines without too much subjectivity.
The only subjectivity with Fibonacci drawings are the pivot points you use. There are many other indicators and techniques to use. I have used many of them over the years but the technique I will describe below has been the one that has helped me the most.
If this post benefits you then awesome! If not then don’t sweat it. Trading is all about finding out what works for you and then discarding the rest. It is all about trial and error.
Trend Trading Using Fibonacci Extensions
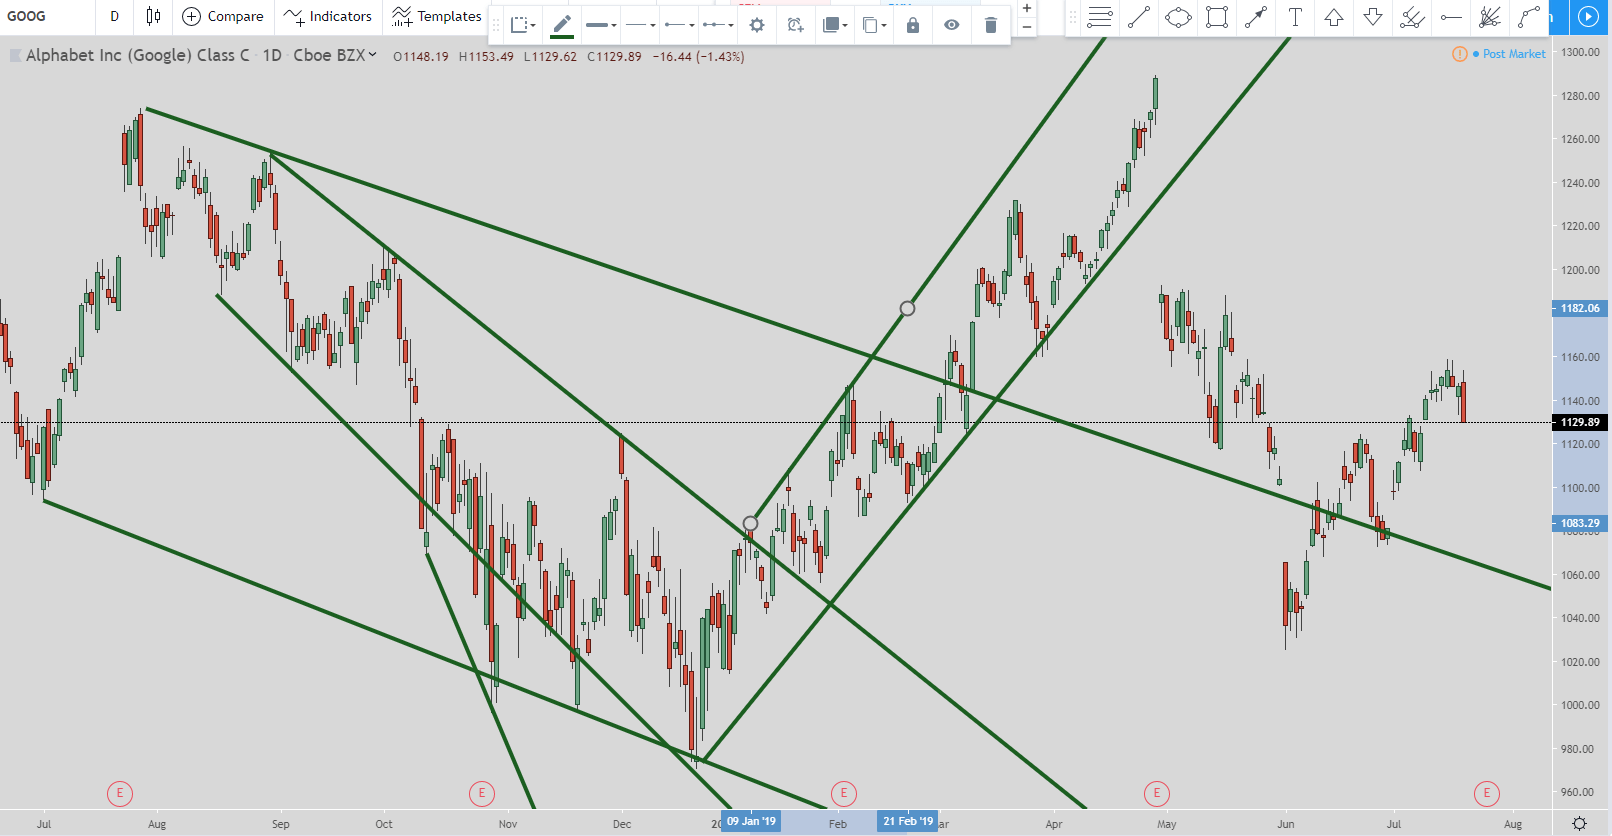
Above is an image of what my stock charts used to look like when I attempted to draw trend lines. Granted, this is a little extreme but the point is I never had a system I could rely on to accurately draw trend lines to determine the current trend. Yes, it is easy after the fact but that doesn’t help me when I am looking to buy or sell in the present. That is the problem I have always have with Elliot Waves. I can only recognize them after the fact.
For what I am about to show you, there are only two Fibonacci levels you truly need for this type of trend trading. The first is the 123.6% extension and the second is the 38.2% retracement level. I try to keep everything as simple as possible because I believe trading shouldn’t be complicated.
This style of drawing my trend lines came to me after I started meditating. It didn’t come right away, it still took some trial and error before I discovered what I am about to show you today. There were times I thought I had it figured out but something would eventually signal to me that the way I drew trend lines was incorrect so I needed to go back to the drawing board.
To be honest I don’t trade from trend lines. There are times I will use them to see how they fit in with one of the setups I am looking to trade. But I can honestly say I don’t use them to trade from their support or resistance levels, or the upper or bottom part of the channels. I know a ton of people love them so I want to share with you how I use them.
The way I trade is that the 38.2% retracement level signals that the upper or lower pivot point is valid. This is what signals to me for my setups that there has been enough of a retracement for the pivot points to be established. Anything less than that then I do not consider it a valid pivot point. This is not just for trend lines, this is what I use for the setups that I trade from.

I also have the 0% line and the 100% line to help line up the pivot points precisely. They are the blue lines in the chart above. The green line is the 38.2% retracement level and the orange line is the 123.6% extension level. I took the rest of the normal Fibonacci retracement and extension levels off of the chart so it wouldn’t be cluttered.
As you can see from the chart above the move retraced to the 38.2% level and then went up and hit the 123.6% level. This is the 1st step in identifying the trend. Once that happens then I connect the lines.
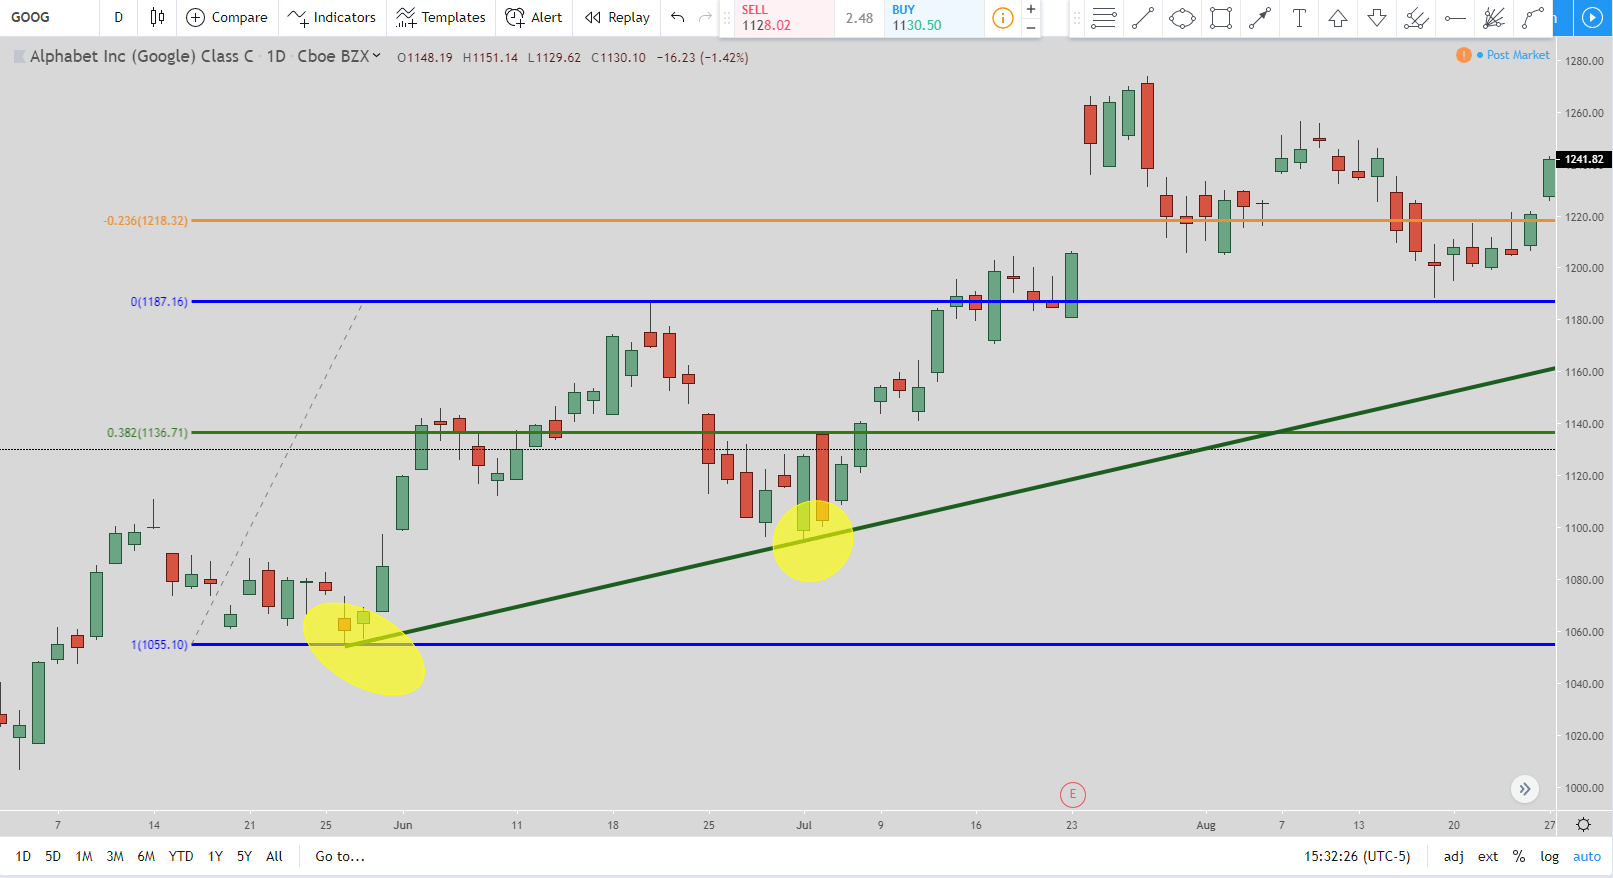
The yellow highlighted areas are the levels you connect the lines. The one on the left is the pivot point low. The yellow circle on the right is the lowest pivot point before the price hit the 123.6% extension and retraced at least to the 38.2% line. If it doesn’t make too much sense then it will once you watch the video I made below. Sometimes the pivot point from the 38% retracement doesn’t give you that clean of a line if there is a lot of up and down action before price hits the 123.6% level. You just have to use your best judgment which is another word for “subjectivity” which I do not like.
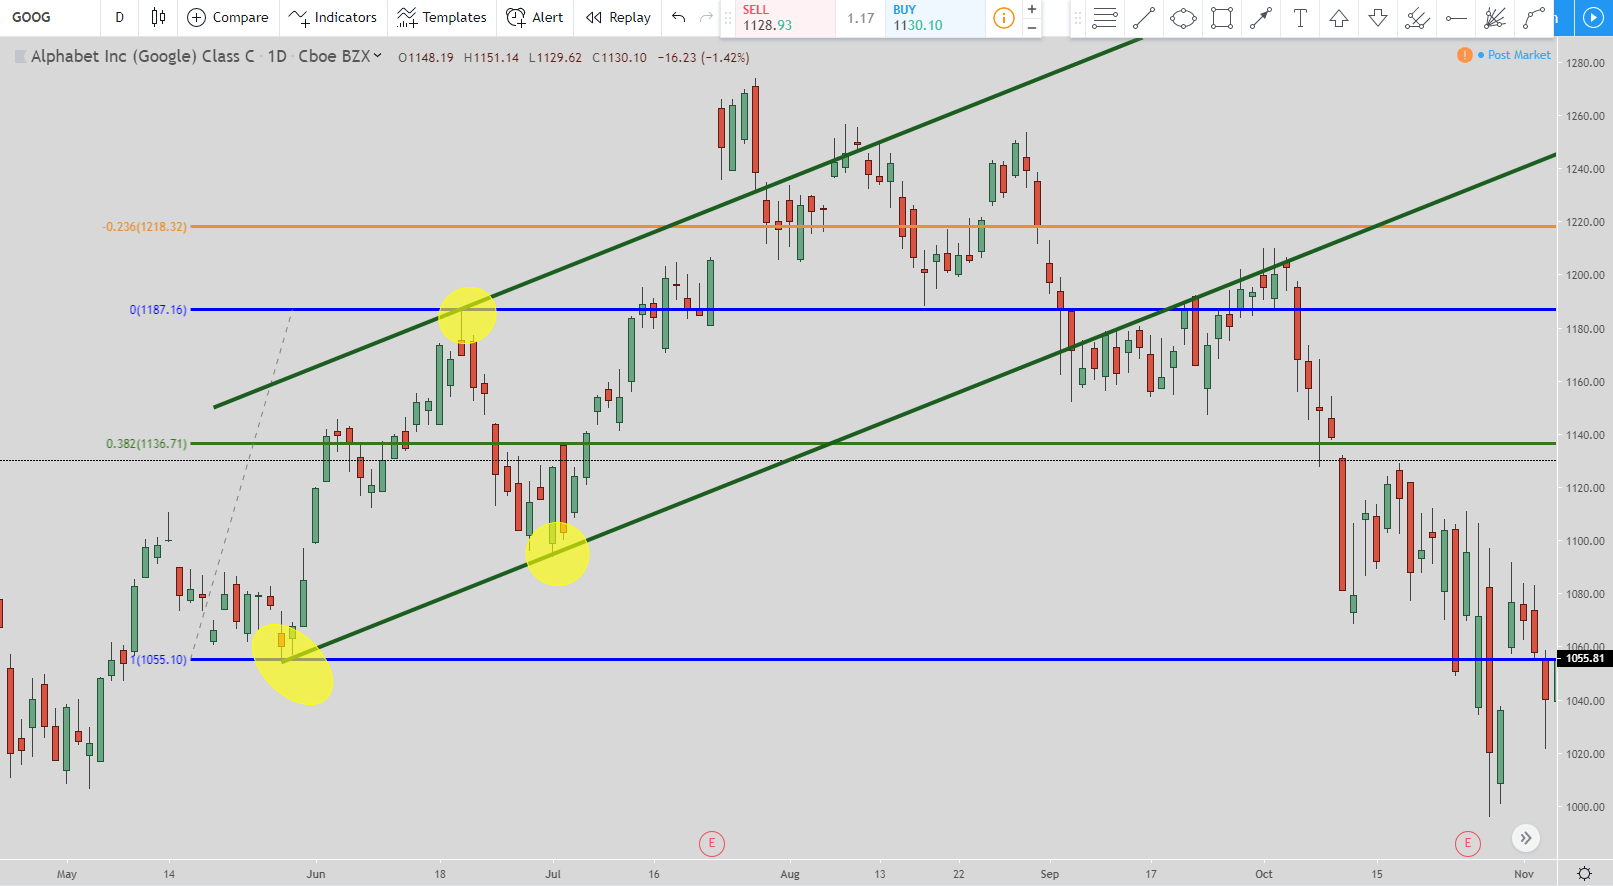
The final chart shows the upper pivot point which is the highest one in yellow. That is the pivot point high. You copy the trend line you previously made and drag it to the pivot point high. That is all there is to it. As you can see from that move that the bottom trend line quickly gave away and soon became resistance before the retracement lower happened. When I do draw trend lines then this is what I use for an overall trend.
Technical Analysis and A New and Easy Way
Investopedia goes into great detail about trend trading: https://www.investopedia.com/terms/t/trendtrading.asp.
Here are the main points of the Investopedia article:
-
Trend trading is a trading style that attempts to capture gains through the analysis of an asset’s momentum in a particular direction. When the price is moving in one overall direction, such as up or down, that is called a trend.
-
Trend trading is a method of trading designed to take advantage of uptrends where the price tends to make new highs or downtrends where the price tends to make new lows.
-
An uptrend is a series of higher swing highs and higher swing lows. A downtrend is a series of lower swing highs and lower swing lows.
-
In addition to looking at swing highs and lows, trend traders utilize other tools like trendlines, moving averages, and technical indicators to help identify the trend direction and potentially provide trade signals
Technical analysis doesn’t have to be hard. All’s it really is for trading is the way you best interpret the charts. There are literally hundreds of indicators and dozens of bar types for graphs but you have to use what works best for you. With the images above I’ll lay out the steps again in a 1-2-3 format that is easy to follow and I will provide a video of it in the next section.
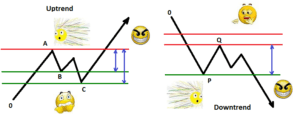
For an uptrend
- Use the 38.2% for the retracement, this ensures the pivot points you use are valid. If the price does not retrace back to the 38.2% level then the pivot points are not valid
- Wait for price to go and hit the 123.6% Fibonacci extension level
- Draw the line from the bottom pivot point to the 38.2% retracement level
- Copy that line and move it to the top pivot point
For a downtrend
- Use the 38.2% for the retracement, this ensures the pivot points you use are valid. If the price does not retrace back to the 38.2% level then the pivot points are not valid
- Wait for price to go and hit the 123.6% Fibonacci extension level
- Draw the line from the bottom pivot point to the 38.2% retracement level
- Copy that line and move it to the top pivot point
Video of the Trend Trading System
Conclusion
I hope you have enjoyed a new viewpoint on how to spot a trend. For years I struggled to identify trends. Sure they are super easy to spot after the fact but when you are looking at getting in a trade you need to be sure you are on the right side of the trend if that is a primary factor you look for.
How I discovered this was through meditation. It truly has been the biggest factor in my trading success. For years I tried to do what the so-called gurus said I should do. Mainly, pay them thousands of dollars to learn from their horrible trading rooms.
Fortunately, those days are long gone. I’ve written another post that has my list of meditation books for traders that has benefited me the most and if you are looking to be more disciplined with your meditation then I wrote another post on how to improve your meditation.
My goal is to help as many people as possible destroy poverty through trading and investing because I truly believe it is one of the worst evils in the world.
If I can be of service to you or answer any questions I will be glad to do so.
Take care,
-Evan

