The stock market, especially the S&P 500 hasn’t been too kind to the bulls since December 3rd. So what is next for the stock market? More sell-off in the works? Or is the downturn over for at least a little while? When I see a huge move like this then I go back to the first trading setup I discovered…..the Bread and Butter trade.
What is Up With the S&P 500?
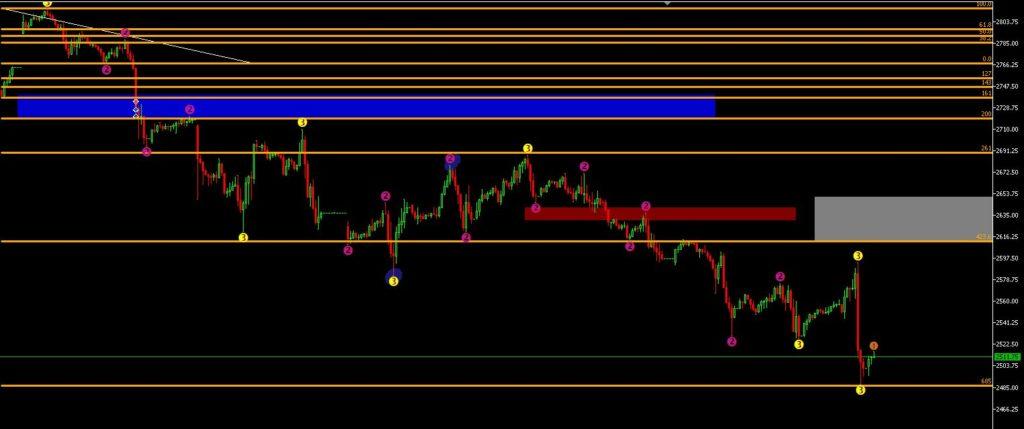
When big moves happen I go back to the basics. Back to the bread-and-butter-trade. You can see from the chart picture above of the S&P 500 that price on the 1 hour chart has reached an extreme level without a retracement to the 50% Fibonacci level. It is at the 685% extension.
Price can definitely get to the extreme levels on the shorter time frames more often than a longer term time frame. I consider anything under a 4 hour chart a shorter time frame. But no matter the time frame when it gets to these levels then the reward to catch a falling knife is way worth it.
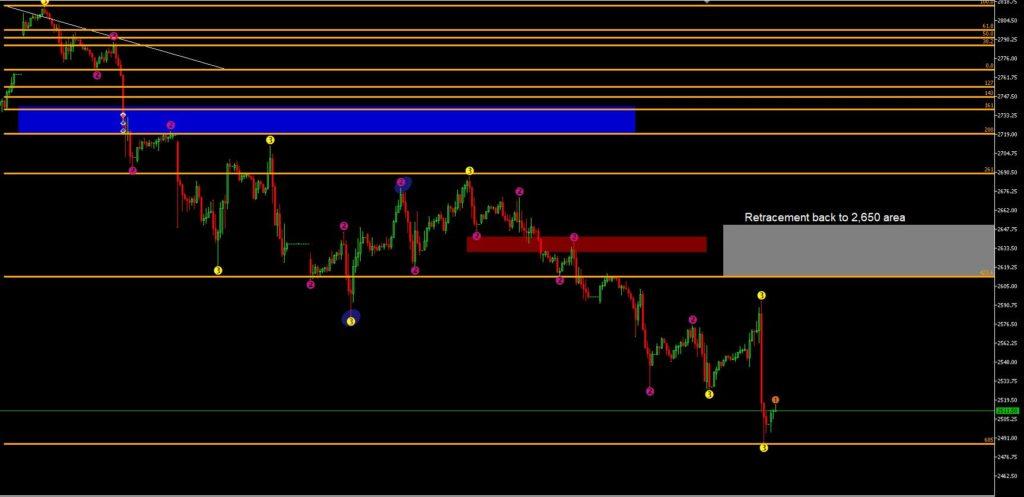
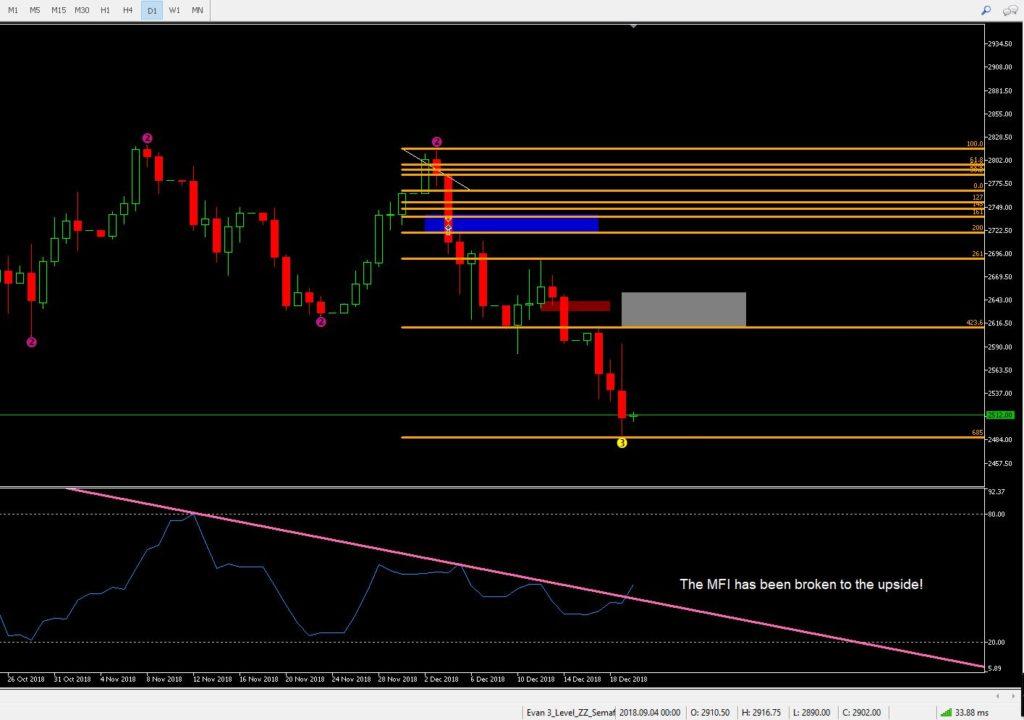
From this second chart the top of the gray box is the 50% Fibonacci retracement level. If price doesn’t make a new low then the exit to complete this downward move will be the 2,650 area.
The Lightning Trade Still Comes Into Play
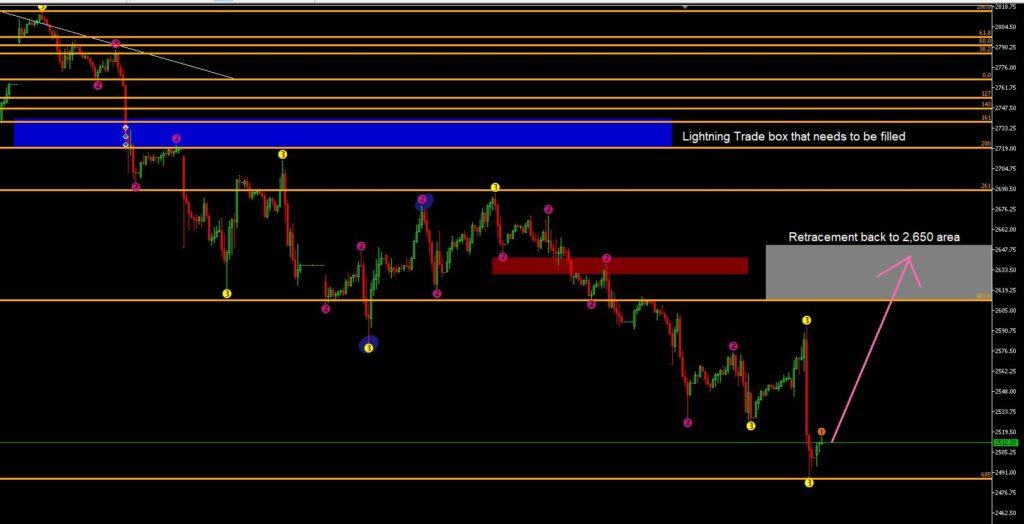
The blue box and the red box are Lightning Trade exit levels that have not been filled. That is another reason why I am so bullish right now. Price will eventually come back up and hit the top of those boxes. There are two lightning trades boxes (that I’ve seen) and the bread-and-butter-trade grey box.
So for the short term look for a move up to at least the bottom of the grey box around 2,610 with the completion being around 2,650. The top of the blue box is 2,.740 and that one will get filled eventually as well.
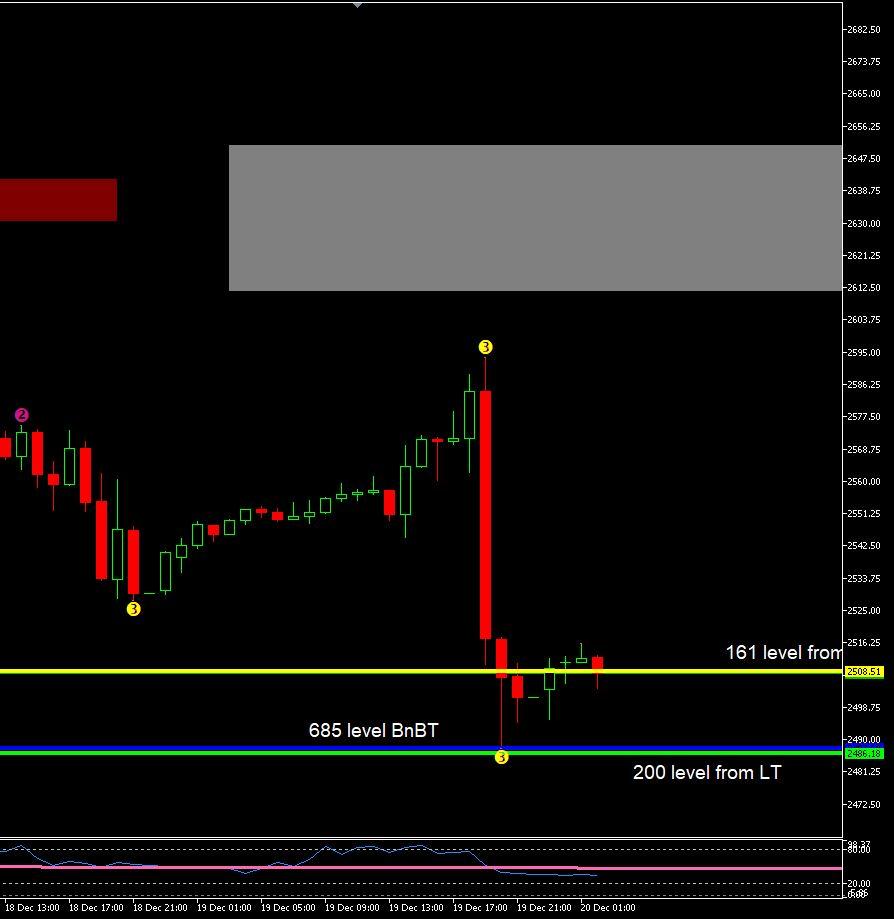
There are also confluence from the 3 moves that have not been filled from their Fibonacci extension levels. The lines on the chart are the yellow, blue, and green. You can see that price has hit those levels and is bouncing off of them. Just another signal to keep in mind for support.
The MFI is Showing a Positive Sign
The Money Flow Index indicator (MFI) is a tool I use to gauge what could take place for a longer term trend. I’ve found it works best on the daily chart. Any time frame less than that provides too much noise. What I look for are 3 indicators:
- Is the signal oversold?
- Is the signal overbought?
- Is the trend line broken?
As you can see from the daily chart the MFI trend line to the down side has been broken. Now that doesn’t mean that price is for sure going to go up right away. I have seen it plenty of times turn back down before price really takes off. In fact it starts to get really obvious when in a down trend that price is making new lows but the MFI is making higher lows. But this is the first step of indicating that the near term down trend is weakening or about to be over.
Conclusion
I think the down turn is just about over due to the considerations I listed above. Between the confluence Fibonacci extension levels, the MFI, the bread-and-butter-trade, and the Lightning Trade boxes that need to go up and be filled leads to too many clues. If you are looking at catching a falling knife then this looks like a good spot. There is plenty of room for price to move up to.
The initial exit would be near the top of the grey box around 2,650 for the bread-and-butter-trade. The next would be the blue box near 2,738 for the lightning trade.
We could be in a bear market now (I have no idea) but even bear markets have short term rallies and I think we have started a rally. As always use your best judgement and everything here is my own opinion and should not be taken as financial advise.
P.S. – If this post benefits you and if you haven’t used Robinhood for trading stocks but are thinking to then please consider using my referral link when you do sign up: http://share.robinhood.com/evanc203.
This way each of us will receive a free share of a random stock if you sign up through my referral link.
My Robinhood Review: https://evancarthey.com/review-robinhood-trading-service-with-no-fees-part-1/


