The market has been going steadily down since the beginning of May. Due to this, the S&P 500 futures are close to a daily buy setup. This is, of course, looking at the daily chart. I will show you the setup I am looking for. Also included will be the detailed entries and exits. The setup will be my 127 long trade which is one of my favorites.
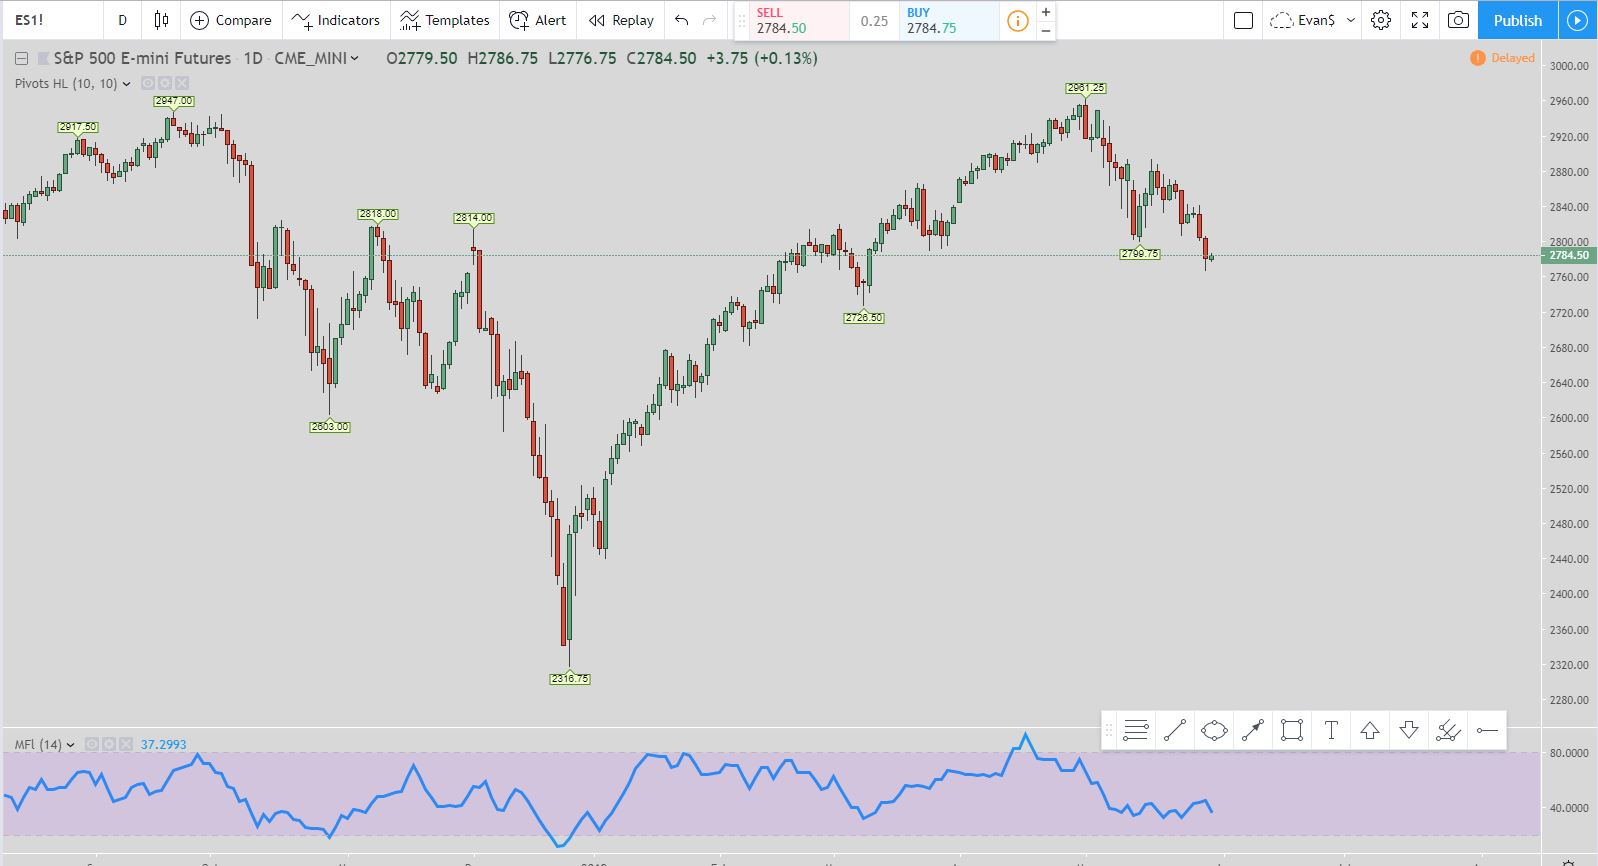
The S&P 500 Futures Are Close to a Daily Buy SetupFrom the chart above you can see the pivot points and how the market has been moving steadily down since the beginning of May.
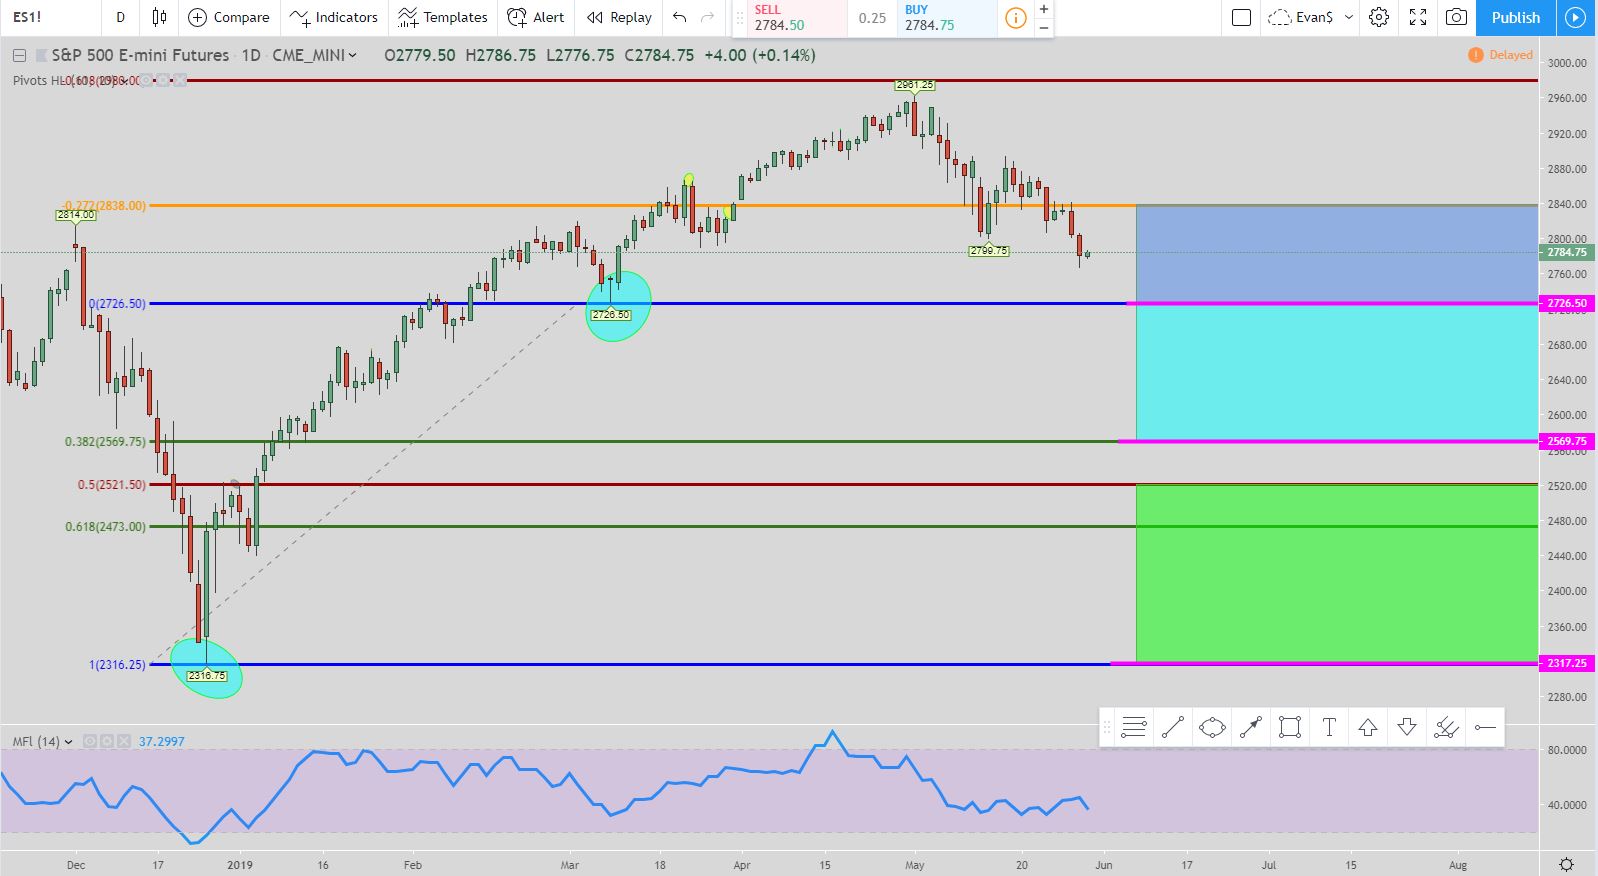
Here is the 127 long setup with the entry and exit levels color coded. We are waiting for the price to retrace to the top pink line at 2726.50. Once it does then that initiates the trade. The exit will then be the top of the blue box at around 2836.
But if the price continues to move down without hitting 2836 then the middle pink line at 2569.75 is the next entry level. If that is hit then the exits move to the top of the teal box at around 2625.
Finally, if the price still does not hit the exit but continues to move down and hit the bottom pink line at 2317.25 then all exits move to the top of the green box around 2520.
If an exit is hit and an entry is not fulfilled then delete it. The move is over. Do NOT look to get in at an unfulfilled entry level if the exit is hit. The move is over and it will time to look for another setup.
If price continues to move lower than 2317.25 without hitting an exit it doesn’t matter. The final exit does not move from the top of the green box at 2520. You can, of course, continue to scale into the trade but the exit does not move. I usually have the Fibonacci extension levels the opposite way at levels to get in for the extreme moves which can happen.
Conclusion for The S&P 500 Futures Are Close to a Daily Buy Setup
The 127 long trade is one of my favorite setups and you don’t see the potential of this trade with such a great amount very often. It looks like the 2726 level is a magnet for the price move down. The MFI indicator still isn’t oversold yet so there definitely could be more downside on the way. This would initiate the trade setup and start the 127 long.
Popular Links
Here are a couple of links if you are looking at how I view the market and some trade setups. You can create your own trading style and setups. Quit paying losing traders to teach you. The only thing they teach is how to lose money.
Robinhood Trading Broker Review
If this post benefits you and if you haven’t used Robinhood for trading stocks but are thinking to then please consider using my referral link when you do sign up: http://share.robinhood.com/evanc203.
This way each of us will receive a free share of a random stock if you sign up through my referral link.
My Robinhood Review: https://evancarthey.com/review-robinhood-trading-service-with-no-fees-part-1/
