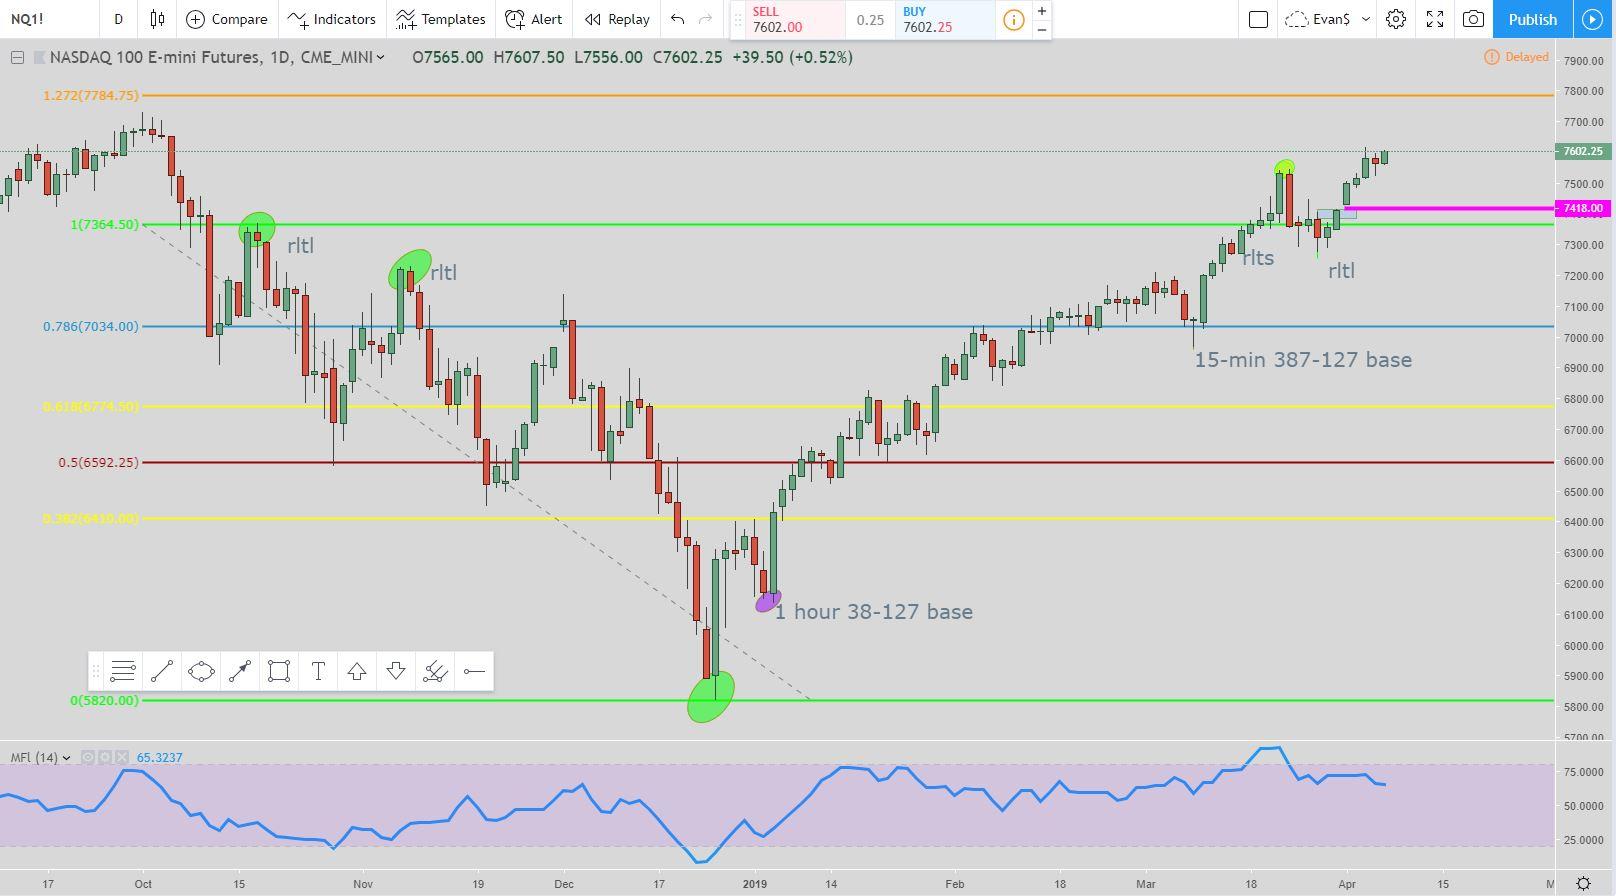
In this video, the S&P 500 and Nasdaq continue to grind higher for the upcoming week of 4/7/2019. On the daily chart, it is nothing but bull setups. The 15-minute chart does have a short setup on each but still extremely bullish. Whenever the pullback happens it will eventually initiate the 38-127 trade to the long side. From the picture below in the daily chart, you can see how it has several long setups using the reverse lightning trade in a row. The S&P 500 chart is similar but not as many long setups.
My Technical Analysis For the S&P 500 and Nasdaq
Both the Nasdaq and the S&P 500 continues to move higher. The interesting thing is there are a couple of more reverse lightning trade long setups on the daily chart for both the ES and NQ.
If those initiate then once price in each makes new highs the only daily chart long setups will be coming from the 38-127 trade. When the pullbacks happen on both we’ll look to catch them with a 38-127 trade to the long side. But until that happens all I can do is wait on it. The market isn’t choppy at all. Right now you only want to be long. You definitely do not want to be short.
Price in each still has room to run up based upon the reverse lightning trades. So unless the longs are going to take a break once price hits the previous market highs there is no reason to short the market. The MFI is interesting because it is starting to move lower even as price climbs.
In the Nasdaq, the MFI was extremely overbought before it retraced some. Now that price is going back up it is making a divergence with lower highs in the MFI. I don’t use the MFI to base my trades off of. It is an indicator that helps show the sentiment and if a pullback could be on the way. The main trades which influence my bias on the market are my reverse lightning trade and the 38-127 trade setup. Both of these were created by me through meditation. I’m sure other people out there use the same setups but they call it something different.
Video: Technical Analysis For the Week of 4/7/2019 – Daily Chart and 15-min
Popular Links
Here are a couple of links if you are looking at how I view the market and some trade setups. You can create your own trading style and setups. Quit paying losing traders to teach you. The only thing they teach is how to lose money.
My Robinhood Shameless Plug
If this post benefits you and if you haven’t used Robinhood for trading stocks but are thinking to then please consider using my referral link when you do sign up: http://share.robinhood.com/evanc203.
This way each of us will receive a free share of a random stock if you sign up through my referral link.
My Robinhood Review: https://evancarthey.com/review-robinhood-trading-service-with-no-fees-part-1/

