Allstate (ALL) stock’s from around February 2017 has been in a range from $77 to $105. Their catch phrase is “Are you in good hands?” So we will see if you are in good hands with their stock. The price is currently around $96 so it is getting close to the upper range of $105. Since December 2018 the stock has risen from $77 all the way to around $100. Now price has settled around $96 so we will look to see what setups are happening and what to look for.
Allstate (ALL): Are You in Good Hands With Their Stock? – Fundamentals
There are 7 fundamental markers I look for in a stock. I try to only purchase growth stocks so these are the parameters I look for to see if a stock meets the majority of the markers. I prefer to have all seven fulfilled. You can it more in depth here: https://evancarthey.com/how-to-scan-for-winning-stocks-an-insiders-view-to-my-process/
- Market Cap: > $300 million
- EPS growth past 5 years: >0%
- P/E: Over 10
- EPS growth next 5 years: >0%
- Sales growth past 5 years: Over 20%
- Debt/Equity: <0.1
- Sales growth qtr over qtr: Over 5%
Does the stock meet these 7 markers?
- Market Cap: 32.05B (YES)
- EPS growth past 5 years: 4.10% (YES)
- P/E: 13.95 (YES)
- EPS growth next 5 years: 11.24% (YES)
- Sales growth past 5 years: 2.80% (NO)
- Debt/Equity: 0.30 (NO)
- Sales growth qtr over qtr: 12.70% (YES)
I used Finviz.com for the fundamental analysis screener.
With Allstate (ALL) only hitting 5 of the 7 then this is close but can’t be considered a growth stock since I look for all 7 to be a “YES.” Although, this is a stock to keep an eye on. Their fundamentals are pretty strong and even though their Debt/Equity is over 0.10, it is only 0.30 which is still very good. Their sales growth over the past 5 years is low but at least it isn’t negative.
Technical Analysis for Allstate (ALL)
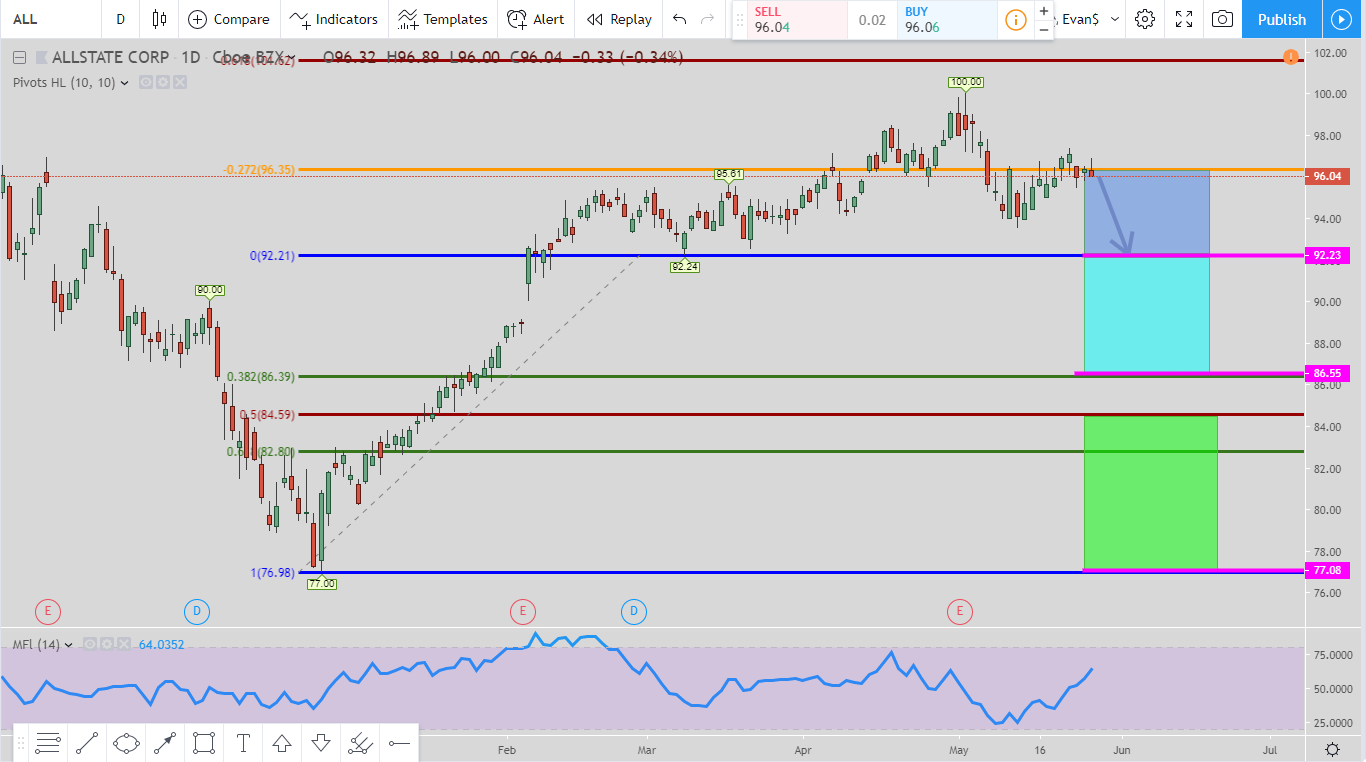
In this daily chart we are looking at the 127 long trade setup. We are waiting for the price to retrace to the top pink line at $92.23. Once it hits that price then the exit is at the top of the blue box at $96.00. But if the exit is not hit and price continues to retrace down to the 2nd pink line at $86.55 then the exits move to the top of the green box at $92.10. Finally, if the exit is not hit and price goes all the way down to the bottom pink line at $77.08 then the exit moves to the top of the green box at $84.50.
Once an exit is hit then the move is over. If an entry has not been initiated then don’t worry about it. The move is over and time to look for another setup.
Even if price continues to go lower and an exit has not been hit you do not move the exit lower than the top of the green box. It just means you can get in at a better price.
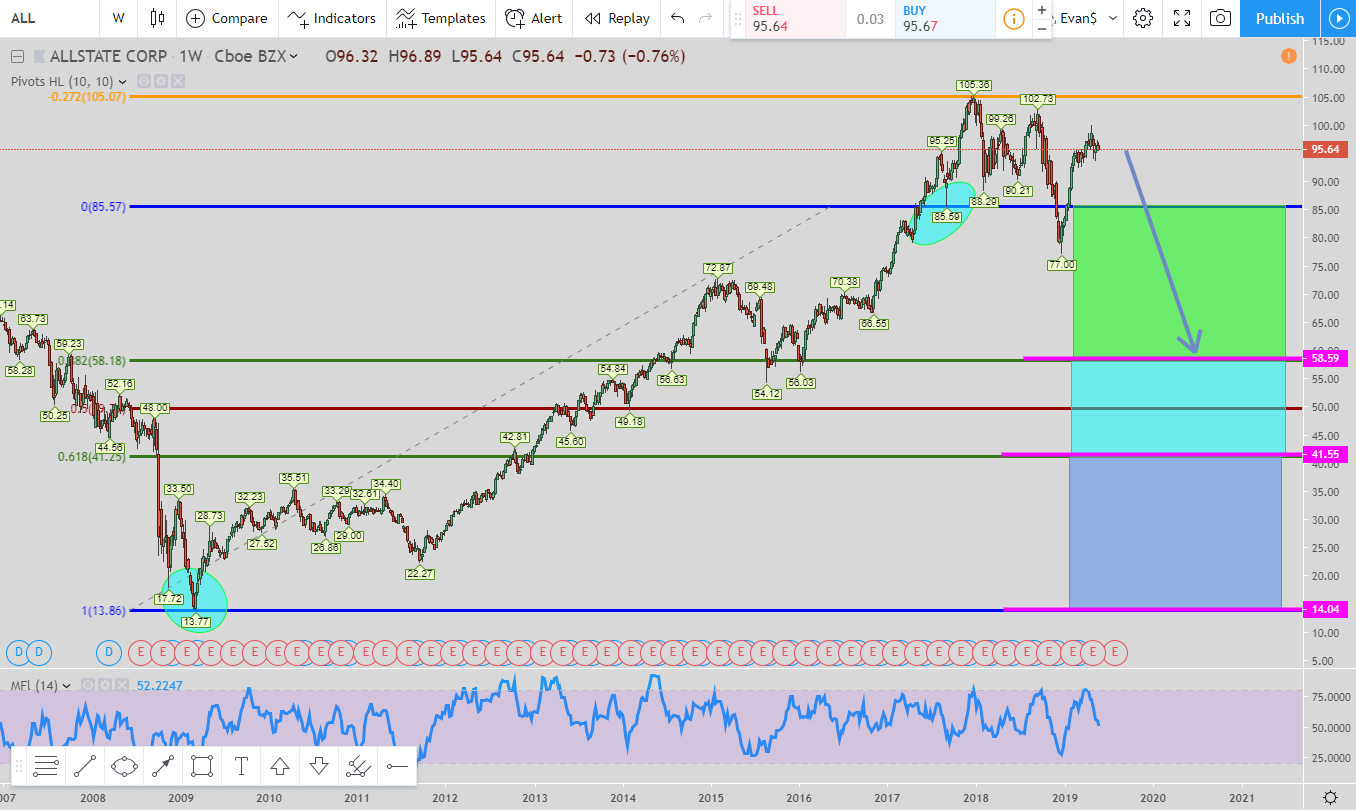
If you enjoy long term plays with the potential to last for years then have I got a great setup for you! In looking at the weekly chart we are looking at the 61B long setup. We are waiting for price to come down and hit the top pink line at $58.59. The same rules apply as the last trade setup. The exits are at the top of the colored boxes and if a new entry level (the pink lines) is hit then the exit moves to the top of the colored box. If an exit is hit then the move is over and DO NOT look to get in at an entry levels that have yet to be hit with the price.
Even if price goes lower than the final entry level without an exit being hit then the exit still does not move from the top of the blue box. That is the final exit.
Conclusion
If you are a range trader then this stock would seem to be up your alley. I am not and have listed the setups above that I would be looking for. Overall, Allstate’s fundamentals do not look that bad so this is a stock I would keep an eye on and see what shakes out in the near future.
Popular Links
Here are a couple of links if you are looking at how I view the market and some trade setups. You can create your own trading style and setups. Quit paying losing traders to teach you. The only thing they teach is how to lose money.
Robinhood Trading Broker Review
If this post benefits you and if you haven’t used Robinhood for trading stocks but are thinking to then please consider using my referral link when you do sign up: http://share.robinhood.com/evanc203.
This way each of us will receive a free share of a random stock if you sign up through my referral link.
My Robinhood Review: https://evancarthey.com/review-robinhood-trading-service-with-no-fees-part-1/


