The gold price forecast will be a combination of several time frames from the charts based upon the trading setups I look for. You do need to prepare yourself because as you’ll see from the charts below, gold is in or getting ready to be short setups in the time frames I cover.
If you are looking for a live feed of the commodities then CNBC has an easy to read tracker that covers the major commodities: https://www.cnbc.com/futures-and-commodities/.
If you are long term bullish in gold then I would suggest waiting until these short setups complete before you add onto your positions. That is what I am waiting on. With gold, I use it as a long term investment and am looking to purchase it when there are big dips. In the charts below, they are my setups I use. Some of them may seem new to you and others are not. I’m not claiming these are proprietary setups that no one else in the world uses. But they are setups I use and they work for me.
That is the key in trading, to find the setups and trading style that works for you and then tailor it to your trading psychology.
Gold Price Forecast – The Charts
In these next charts, I will go over the monthly, weekly, daily, and 4-hour chart. This will give us a good idea of what to anticipate for the near, medium, and long term future for the gold price forecast.
Monthly
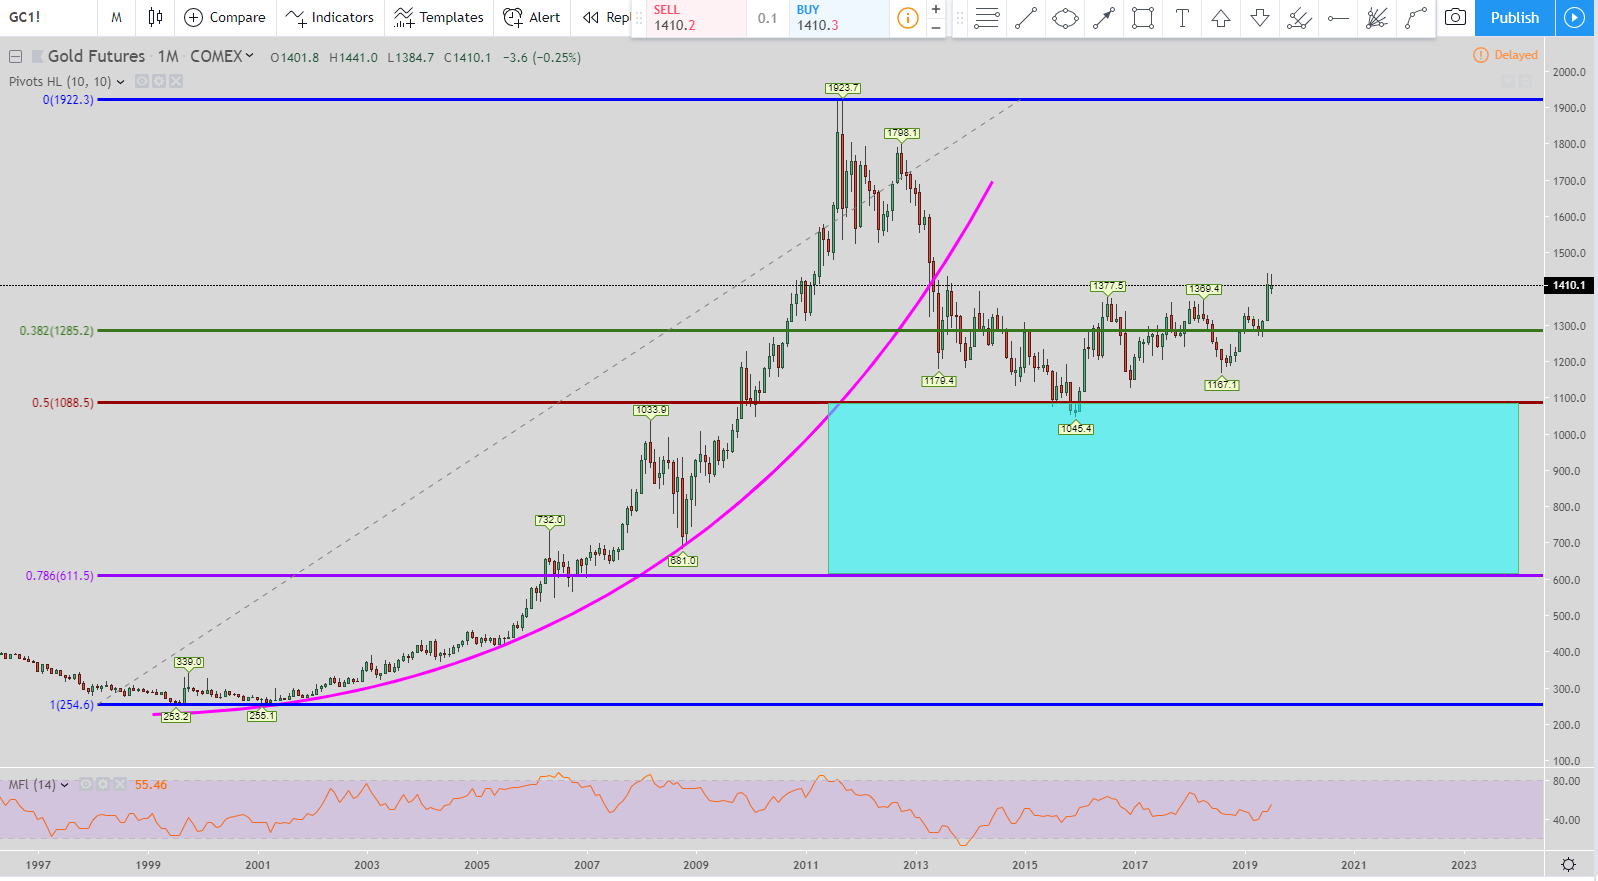
The monthly chart above goes all the way back to 1997 so we are looking at over 20 years here. The pink curve line is the parabolic curve which is a very important aspect of this chart. Parabolic curves can be slightly subjective based upon the person drawing it so I always try to err on the conservative side with the steepness of the curve.
As you can see the price of gold broke out from the parabolic curve in 2013. When it did so it eventually went down and hit the 50% Fibonacci retracement level at around $1,088.50. When the parabolic curve is broken then there are two targets we look for. The first is 50% which has already been hit and is the top of the teal box. The 2nd target is the 78.6% retracement level that is the purple line and at the bottom of the teal box around $611.5.
Now price isn’t guaranteed to hit the 2nd target at $611.5. It has already hit the 50% target which is enough to consider the move complete. But it still could come back and hit the 78.6% level so that cannot be ruled out until the high of $1,923.70 is broken. Once the previous high is broken then the retracement for that parabolic curve is over.
I wanted to show how the 50% retracement level has already been hit and to be aware that the 78.6% level is still in play but it isn’t guaranteed to be hit like the 50%.
Weekly
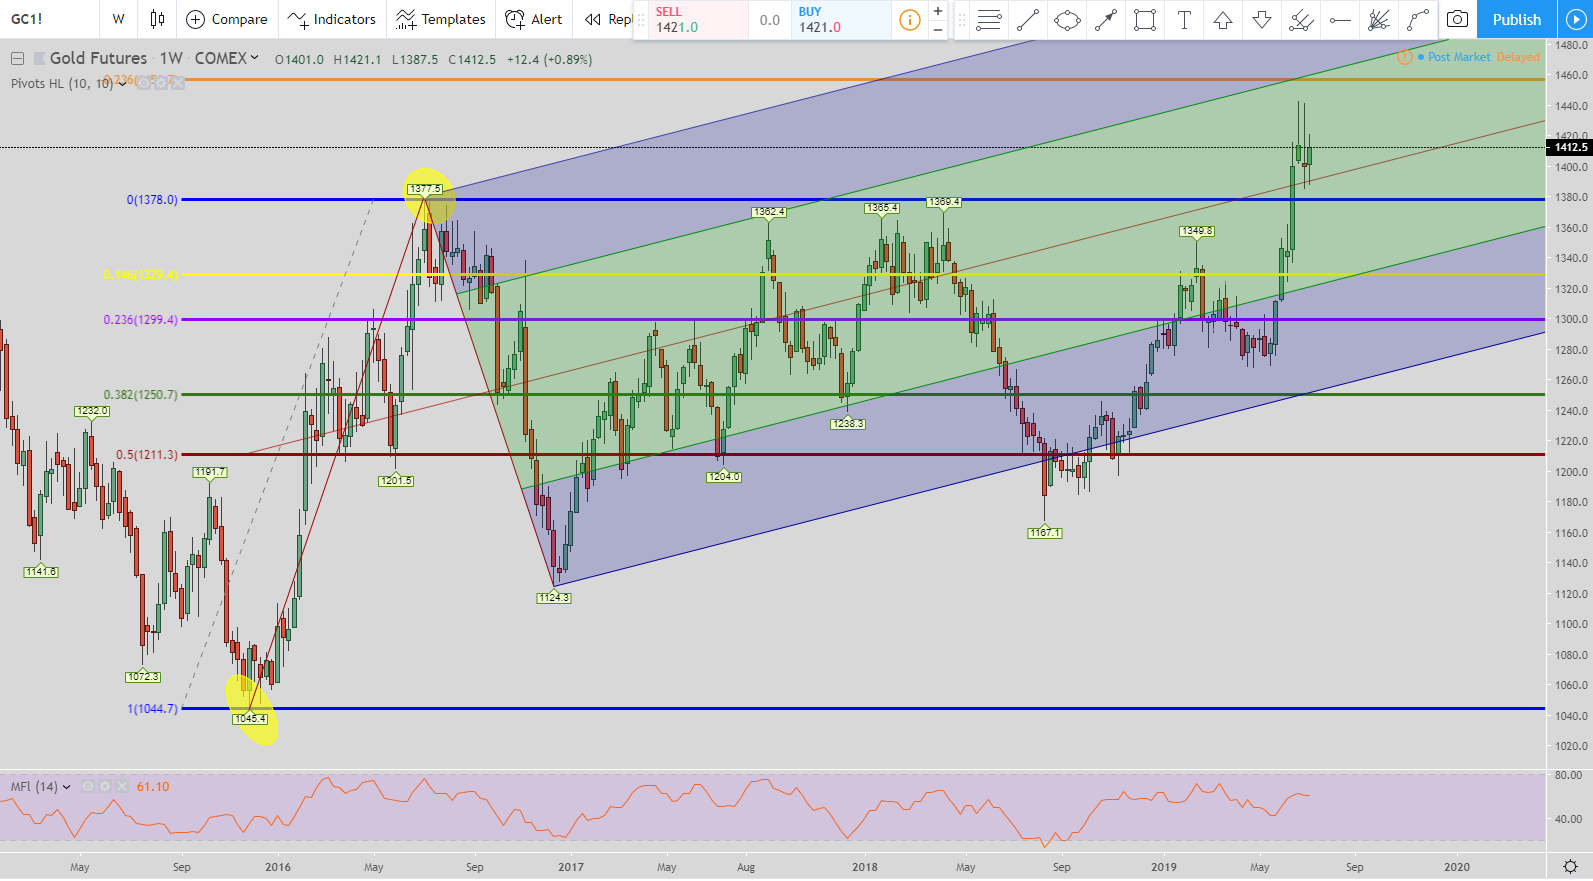
With the weekly chart, we have an interesting situation developing. A potential short setup that could be forming is underway. Where price is currently located, it is riding the median line of the Schiff pitchfork after breaking the pivot high that I highlighted in yellow. If the price closes below the median line (the diagonal red line) BEFORE hitting the 123.6% Fibonacci extension level then we have a short trade on our hands.
This would be an aggressive entry because I like to have 2 filters met before entering a Springboard trade setup. The second filter is price retracing down to the 23.6% Fibonacci retracement line. But with the 1st filter being the median line being broken then that is enough to consider it a short trade to take.
But if the price goes up and hits the orange line at around $1,460 before breaking the Schiff pitchfork median line then the Springboard short setup is null and void. That would create a 123-161% short setup but I’ll go over it if the price ever gets to that setup. Right now I am focused on the Springboard short setup.
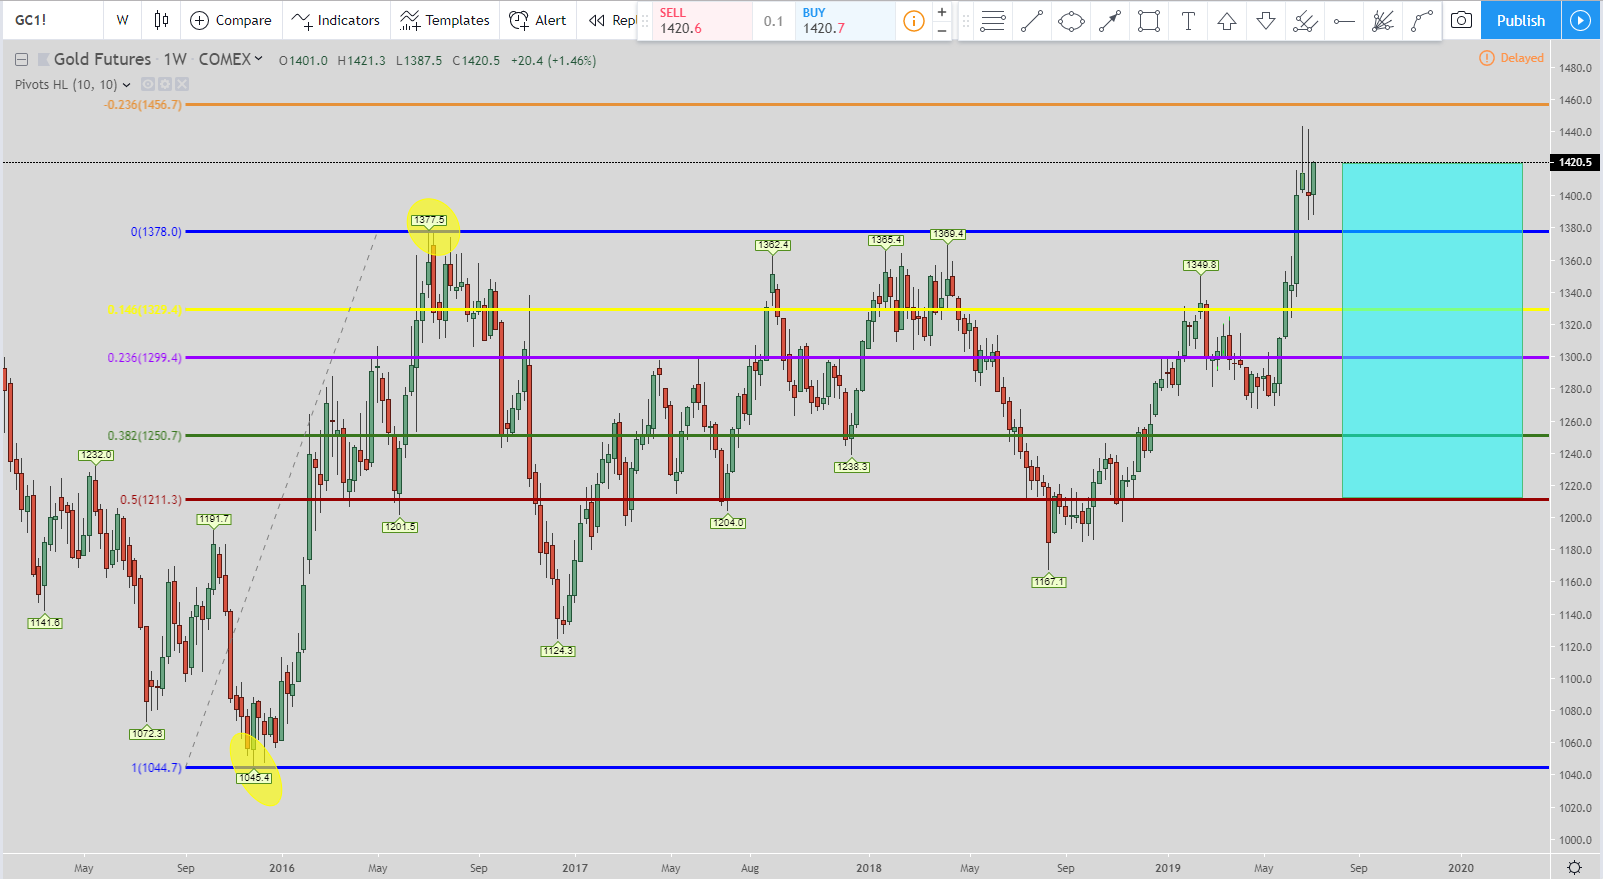
The chart above is to show the exit if price closes below the Schiff median line. If that happens then the initial exit would be the 50% retracement level which is the red line and also the bottom of the teal box at around $1,211.30. This exit can change depending on what the price of gold does as far as retracements and movements but that is the initial exit. If the short Springboard setup is initialized but the price goes up and hits the 123.6% Fibonacci extension level then the exit moves to the yellow line at around $1,329.40 which is the 14.6% retracement level. There are a couple of other exits that could happen but those are the main two if the price closes below the Schiff median line before hitting the 123.6% Fibonacci extension level.
The final potential exit would be if the short setup is initiated. the price goes down and hits the purple line which is the 23.6% retracement level at around $1,299.4 BUT then goes up and hits the 0% retracement level (the blue line). If that happens then the exit moves to the 23.6% level at around $1,299.40.
I’m going to do a video to go along with this post that will explain the exit strategy much easier.
Daily
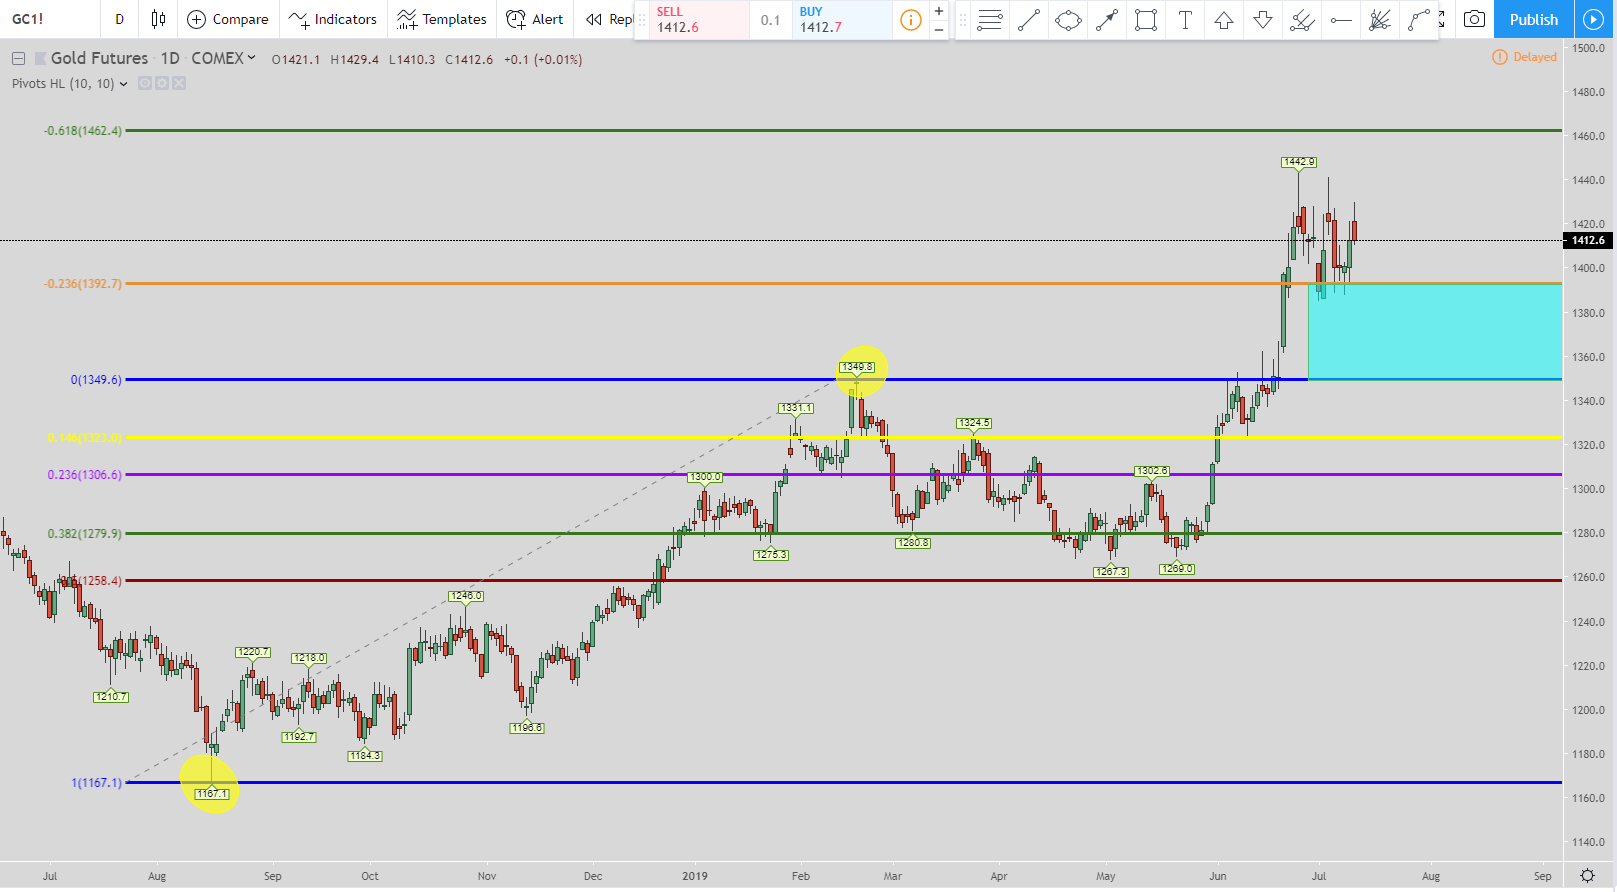
In the daily chart for the gold price forecast, we are currently in a 123 to 161 short setup. When the price hit the 123.6% Fibonacci extension level that initiated the trade. The bottom of the teal box at the 0% retracement level is the current exit. That is around $1,350.
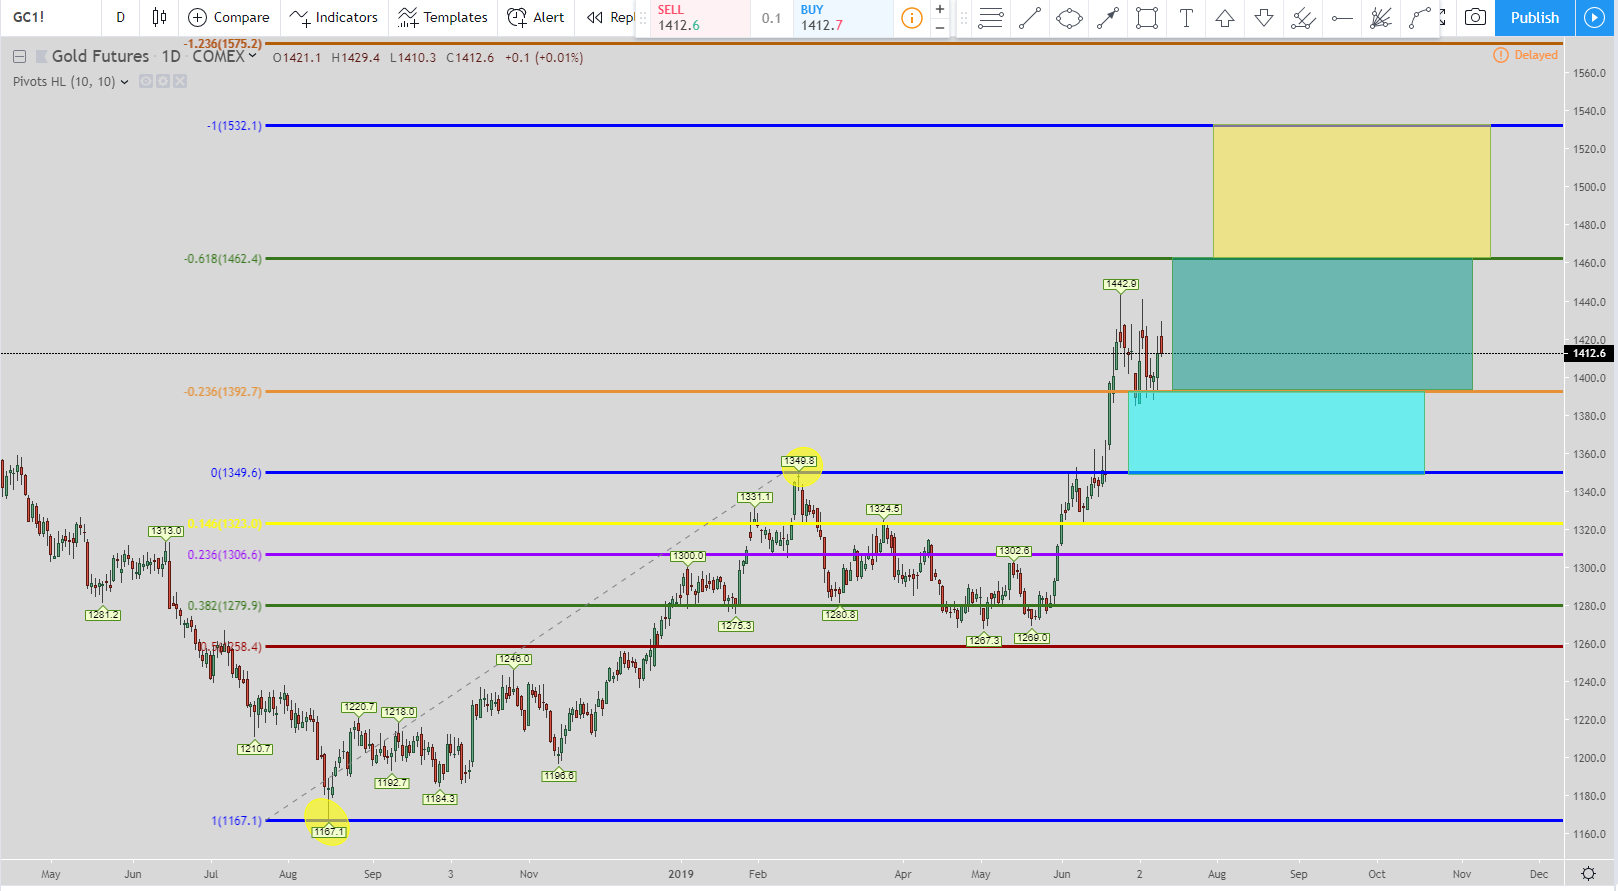
Here I added the other entry and exit levels. But these other levels are ONLY activated if the price does not go down and hit the bottom of the teal box first. If price hits the bottom of the teal box first then the trade is over and it is time to look for another setup.
But if the price of gold continues to move up and hit the 1.618% Fibonacci retracement level first which is the top of the green box (or the green line) at around $1,462 then the exits move to the bottom of the green box. That exit would be around $1,393.
If the price of gold still continues to go higher without hitting $1,393 and hits the 200% Fibonacci extension level (the blue line or the top of the yellow box) then the exits move to the bottom of the yellow box around $1,463. That is the last time you move the exit. Even if the price continues to move higher you do not move the exit anymore. You can, of course, continue to short gold if it moves higher but your exit stays at around $1,463.
This is one of my favorite trade setups so for the daily chart I am very bearish for gold until this setup is completed.
4-Hour
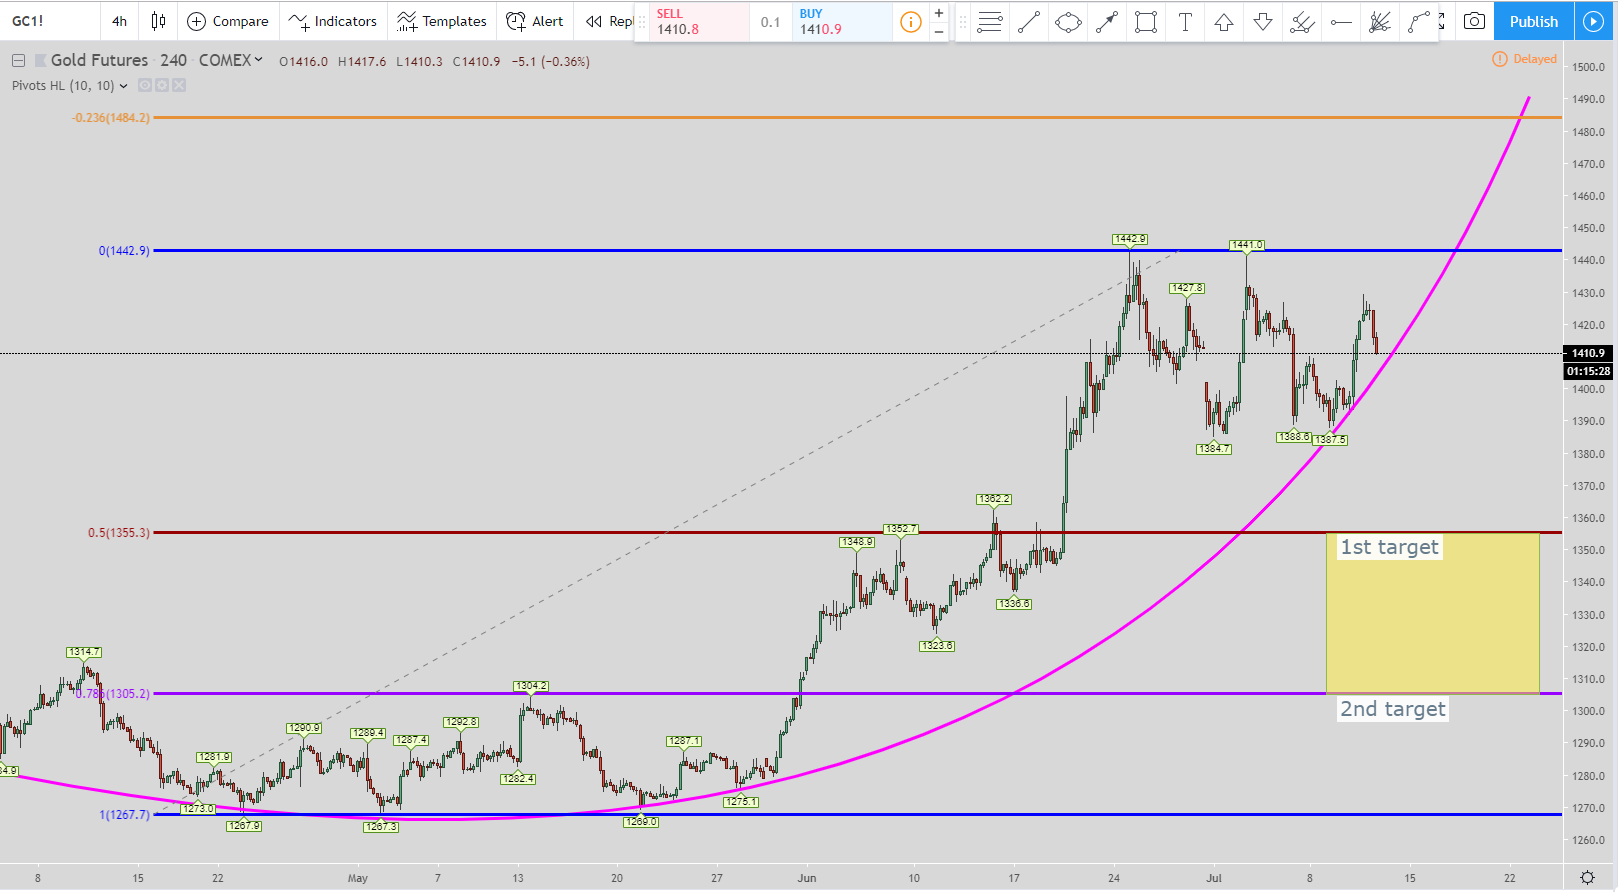
With the 4-hour chart, we are looking at another parabolic curve setup. The one warning I have with parabolic curves is the line is subjective to whoever draws it. So it can be biased. I try to draw them as conservative as possible in order to make sure it is a clear break of the parabolic curve. Even when price does break the parabolic curve there is usually a fake move back up which is where I recommend going short in order to be safe. The fake move back up after the break doesn’t always happen but it keeps you safer than getting in when you think it is the first close below the line.
So if my parabolic curve is accurate then it is getting very close to being broken. Once that happens then there are two targets we look for. The 50% Fibonacci retracement and 78.6%. 50% is the one that will be hit. The 78.6% doesn’t have to be hit. So if you are looking at shorting gold when the parabolic curve is broken then have your 1st exit at the top of the yellow box around $1,356. When that is hit you can either get out of your position there or you can move the rest of your stop loss to break-even and see if the 78.6% level will be hit.
Personally, I would get out at the 50% level with the full short trade. I’m not saying I am going to take this trade but if I do then I would get out of the position at the 50% level.
Video Review of the Charts
Gold Outlook for The Next 5 Years
In my opinion, gold is a commodity that you can buy anytime there is a big dip. Same with silver. It isn’t going bankrupt like the stock of a company could. So if gold has a big dip, let’s say it does go down and hit the 78.6% retracement level from the parabolic curve break at $611 in the monthly chart. That would be an amazing opportunity to start purchasing it because it eventually will go back up. If it continues to go lower than $611 then you can keep adding into your position. I’m not saying that is going to happen but I would look at that specific trade from a long term perspective.
The next 1-3 I think there will be a little downside to expect until those short setups I mentioned above are complete. They could be completed sooner than that. If they do then I would become more bullish on gold over the next 5 years. Currently, I am bearish on gold because just about every time frame I showed above has a short setup gold is currently in or is getting ready to be in.
But after that shakes out then the bullish setups will start presenting themselves which would create great buying opportunities.

Conclusion
I hope this gold price forecast for 2019 gave you some items to consider whether you are looking to get into gold using a shorter or longer time frame. If you are currently in gold then I hope you see the short setups that gold is currently in and the ones on the horizon.
The setups presented are ones I use. They may not work for you and that is perfectly fine. The goal is to find the trading style and setups that work for you and then customize it to maximize your profitability.
I am a big believer that you have to create your own trading style or system that works for you. Since every single person has a different psychological makeup then no two people will have the same trading style. It has been through meditation where I discovered what kind of trader I wanted to be. It also brought me to the trading setups which worked for me and how I needed to customize them to fit my trading psychology.
I do recommend you learn all you can and then tailor your trading style to fit your strengths. Please avoid paying someone thousands of dollars and trying to copy how they trade. You will more than likely blow your account and also be out an extra couple of thousands of dollars trying to copy a trader who doesn’t make money trading.
If you would like to see the exact steps I take in creating my own trading setups through meditation then check out this article I wrote: https://evancarthey.com/how-to-become-a-profitable-trader-using-meditation/
If you would like further reading to the meditation and psychological books that have had the most influence on my life then read this post: https://evancarthey.com/best-meditation-books-for-traders/
Finally, if you are just starting out in the world of trading then read my beginner’s guide. It has the information I wish people had told me before I started putting my money on the line in the world of trading: https://evancarthey.com/a-beginners-guide-to-day-trading/
My goal is to assist you in becoming the most profitable trader you can become. I seek to destroy poverty and if I can help you in your trading career in any way please let me know.
Take care,
Evan


