This post will use my technical analysis and review the CELG stock that more people know as Celgene. In this post, it will be relevant for the rest of 2019 but it will flow over into 2020 because I am looking at the 1-hour, daily, and weekly charts.
With stocks, I believe it is important to look at the fundamentals to make sure you aren’t buying a total crap stock (like I have done plenty of times in the past). The growth stock markers I look for help weed out the crap stocks that are doomed for bankruptcy. It isn’t guaranteed but it helps.
If you don’t know much about Celgene then here is a little background info. The CELG stock is from Celgene who is an American biotechnology company that discovers, develops and commercializes medicines for cancer and inflammatory disorders.
Here is more about them from their Wikipedia page:
The company’s major product is Revlimid (lenalidomide), in combination with dexamethasone for the treatment of multiple myeloma patients. Revlimid is also approved in the United States for the treatment of patients with transfusion-dependent anemia, due to Low- or Intermediate-1-risk Myelodysplastic syndromes (MDS) associated with a deletion 5q cytogenetic abnormality with or without additional cytogenetic abnormalities.
Revlimid is sold through proprietary risk-management distribution programs, to ensure safe and appropriate use of these pharmaceuticals. Vidaza is approved for the treatment of patients with MDS.
Celgene Cellular Therapeutics, a subsidiary, is a public cord blood bank.
In early January 2019, the company announced it would be acquired by Bristol-Myers Squibb for $74 billion ($95 billion including debt)[22], in a deal that would become the largest pharmaceutical-company acquisition ever.[23]
Under the terms of the deal, Celgene shareholders would receive one BMY share as well as $50 in cash for each Celgene share held, valuing Celgene at $102.43 a share; representing a 54% premium to the previous days closing price.[23]
The activist investor Starboard Value LP opposed the deal, nominating five alternative potential directors on the Bristol-Myers board.[24] The deal was approved by shareholders in April 2019 with 75% of shareholders voting in favor of the deal, 24% voting against and less than 1% abstaining.[25]
The Fundamentals for Celgene’s Stock
There are 7 fundamental markers I look for in a stock. I try to only purchase growth stocks so these are the parameters I look for to see if a stock meets the majority of the markers. I prefer to have all seven fulfilled. You can it more in-depth here: https://evancarthey.com/how-to-scan-for-winning-stocks-an-insiders-view-to-my-process/
- Market Cap: > $300 million
- EPS growth past 5 years: >0%
- P/E: Over 10
- EPS growth next 5 years: >0%
- Sales growth past 5 years: Over 20%
- Debt/Equity: <0.1
- Sales growth qtr over qtr: Over 5%
Does the stock meet these 7 markers?
- Market Cap: 64.90B (YES)
- EPS growth past 5 years: 26.50% (YES)
- P/E: 14.21 (YES)
- EPS growth next 5 years: 16.57 (YES)
- Sales growth past 5 years: 18.70% (NO)
- Debt/Equity: 2.48 (NO)
- Sales growth qtr over qtr: 13.80% (YES)
I used Finviz.com for the fundamental analysis screener.
The CELG stock is extremely close to being considered a growth stock. This a company I will put on my radar for a potential trade. I have no plans to own Celgene’s stock in the next 48 hours and I do not currently own any.
The reason why I look for growth parameters is that in my experience those fundamentals provide the best opportunities for the biggest gains. But even more important as I mentioned above, it helps filter out the terrible stocks you should never buy. When I first started trading stocks I thought the technical analysis would be enough to get me through.
Boy was I wrong! This led me to own several stocks that went bankrupt such as Windstream and the Black Box Corp. It also led me to purchase some terrible performing stocks such as CBL & Associates Properties, Five Prime Therapeutics , and Teva Pharmaceutical’s.
So don’t do my mistake and completely ignore the fundamentals when you are looking at trading or investing in a stock.
The CELG Stock Technical Analysis Review
1-Hour Chart
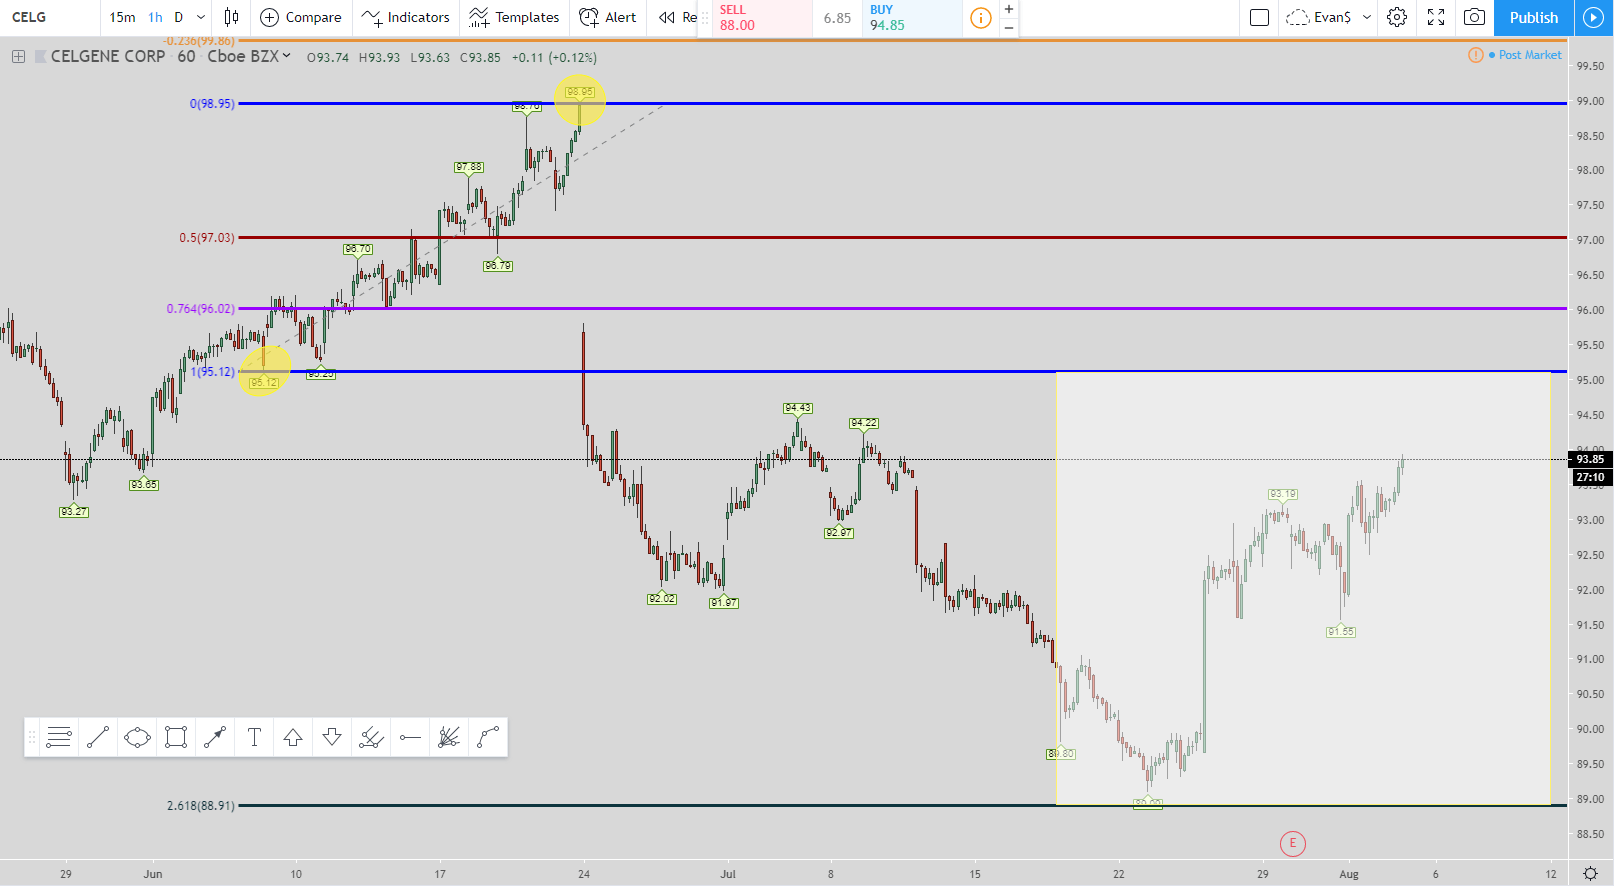
This setup is the 76.4% long setup. In looking from left to right you can see how price went through the 76.4% and the 100% without any type of retracement. So the exit levels for both of those were missed.
The next entry-level is the 261.8% Fibonacci level. Price missed it by 0.18 cents but that is good enough for government work. So I say it is close enough to have hit it. One thing I noticed in stocks is it is better to err on the side of caution than to always stick to precise entry and exit levels when using Fibonacci retracements and extensions.
So when a price comes within 20 cents after a $10 drop-in price, then just say that is close enough for the entry-level to be hit. That is what I do for Forex as well. My entries are slightly before the exact entry and my exits are slightly before the precise exit level.
With that said, when the price hits the 261.8% level and since the exits from the 76.4% entry and 100% entry were neither hit then the exit becomes the 100% level at around $95.00. I would recommend going a little lower so I would make it around $94.80 just to ensure your exit gets filled and gets you out.
That is at the top of the white box.
Daily Chart
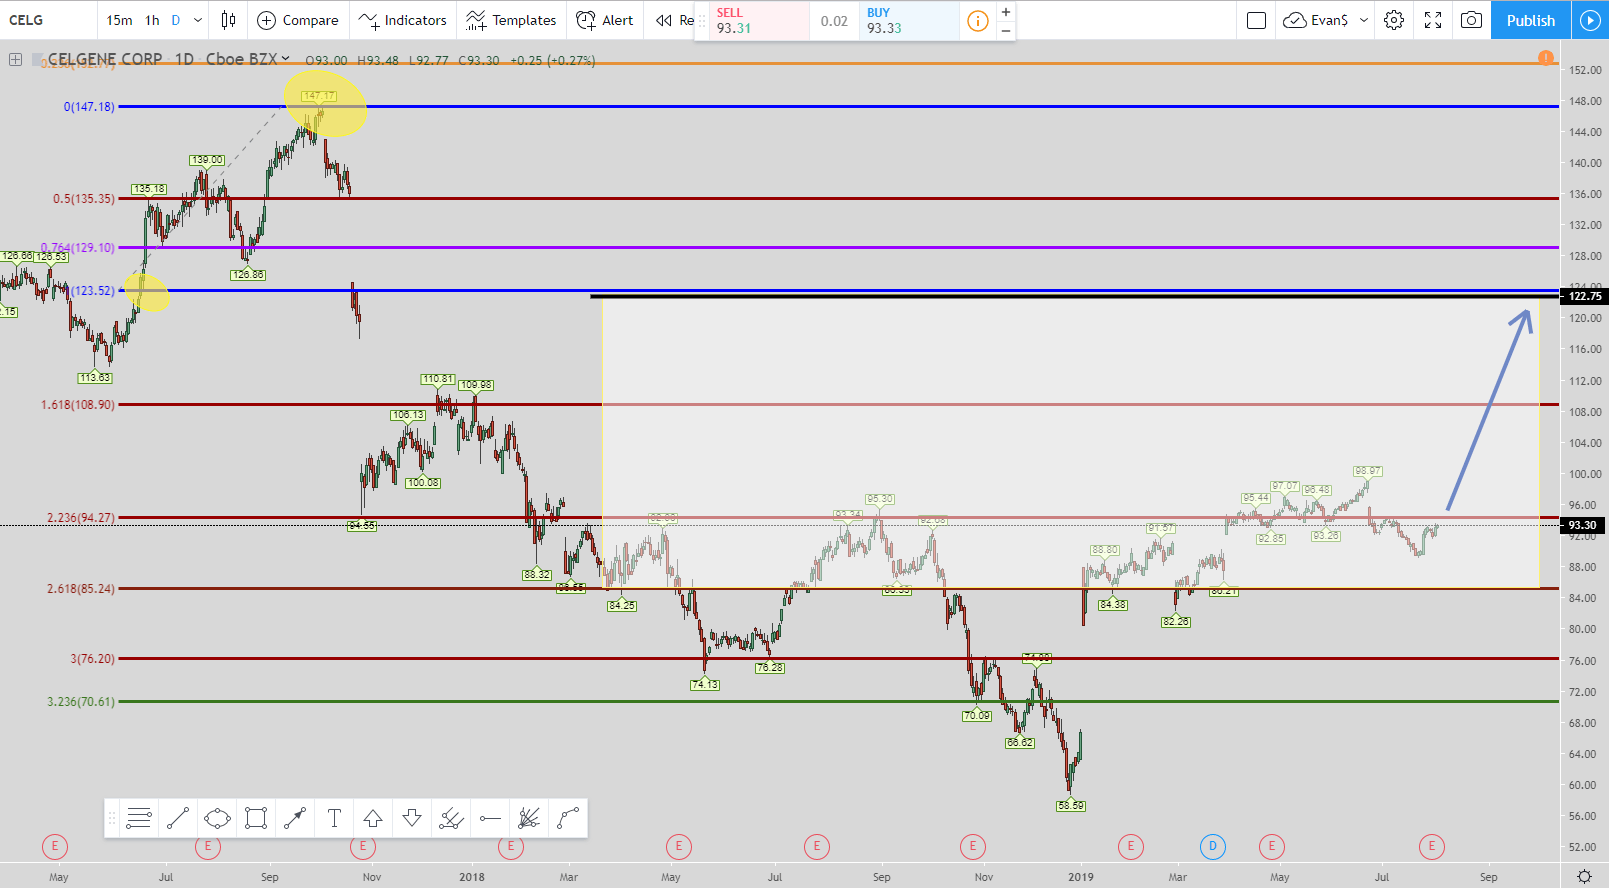
This setup is the 76.4% long setup. Price blew through the 76.4% and the 100% level which were the first two entries. Then when the price of the CELG stock hit the 2.618% Fibonacci extension level that was the next entry.
When that entry happened then the exit moved just south of the 100% Fibonacci retracement level that I drew with a black line. You could even come down a little lower to ensure you get filled when the price goes back up to that level.
You also could have added to your position at the 3.236% Fibonacci extension level which is the green line. So from here on out the exit does not move from the black line as far as if the price drops again. As I mentioned earlier you could come down a little lower than $122.75 for your exit such as down to $120 just to ensure your exit gets you out when the price retraces back up.
So for this setup, you have a very nice long setup in the daily chart for the CELG stock.
Weekly Chart
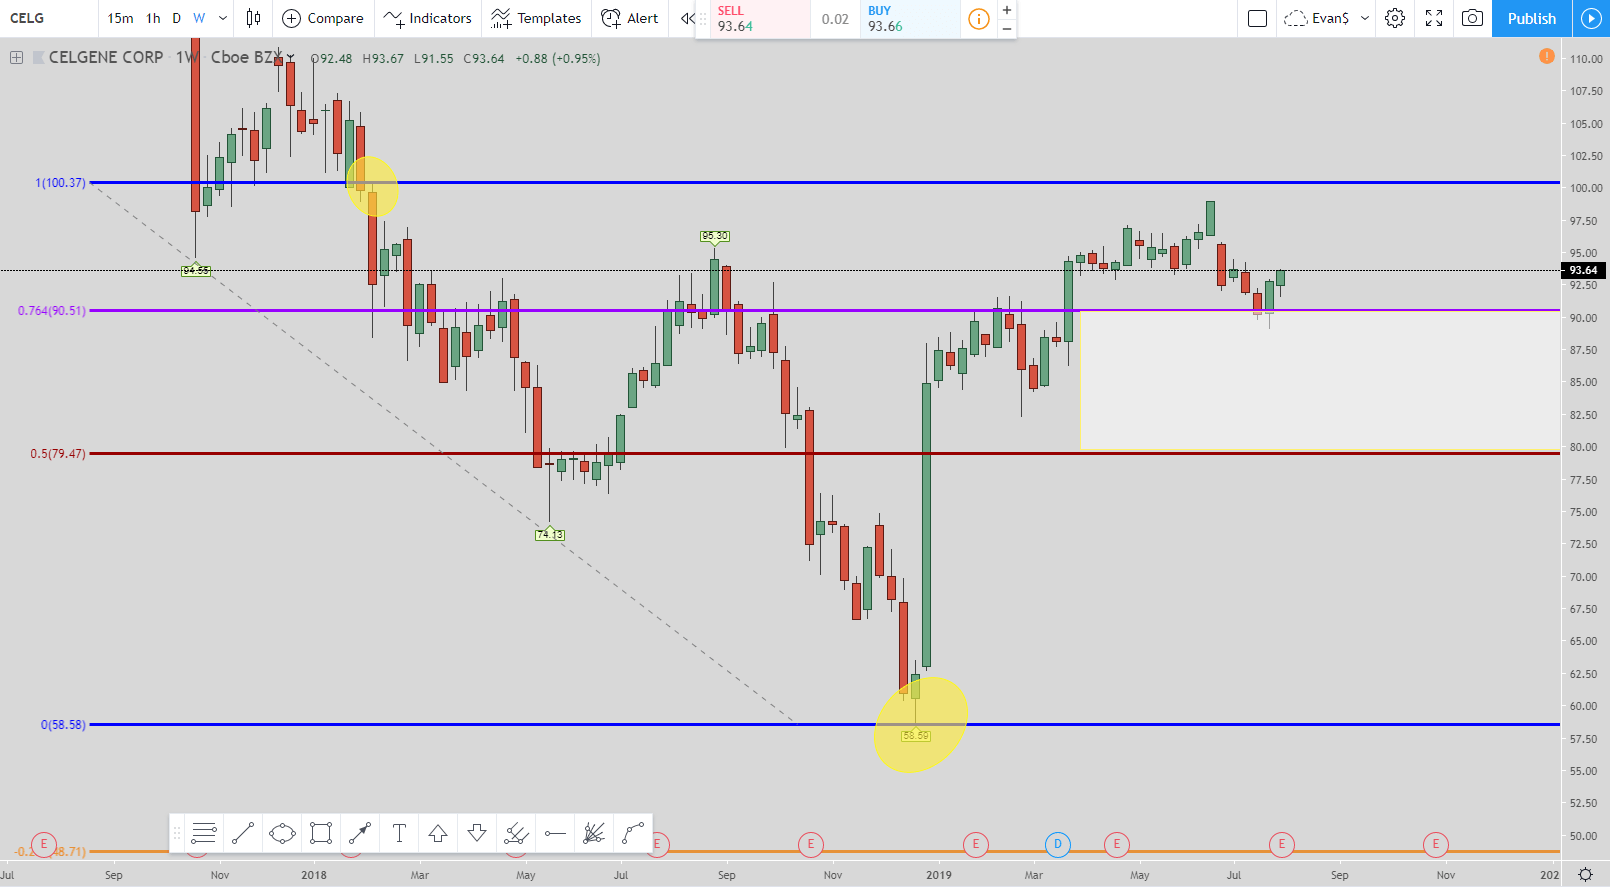
In this 76.4% short trade the current exit is the 50% Fibonacci retracement level. As you can see, the price of Celgene went up through the 76.4% retracement level but has not yet reached the 100% level.
If the price hits the 100% level then the exit will move to the 76.4% level which will be around $91. I always place my exits slightly above the hard exit when going short to ensure my exit gets filled.
Lastly, if the price continues to go way up without hitting either of those exits (depending on if the price hits the 100% level) then you would get in again at the 261.8% Fibonacci extensions level.
The picture below shows where it is located. The price is around $168.00 for that entry.
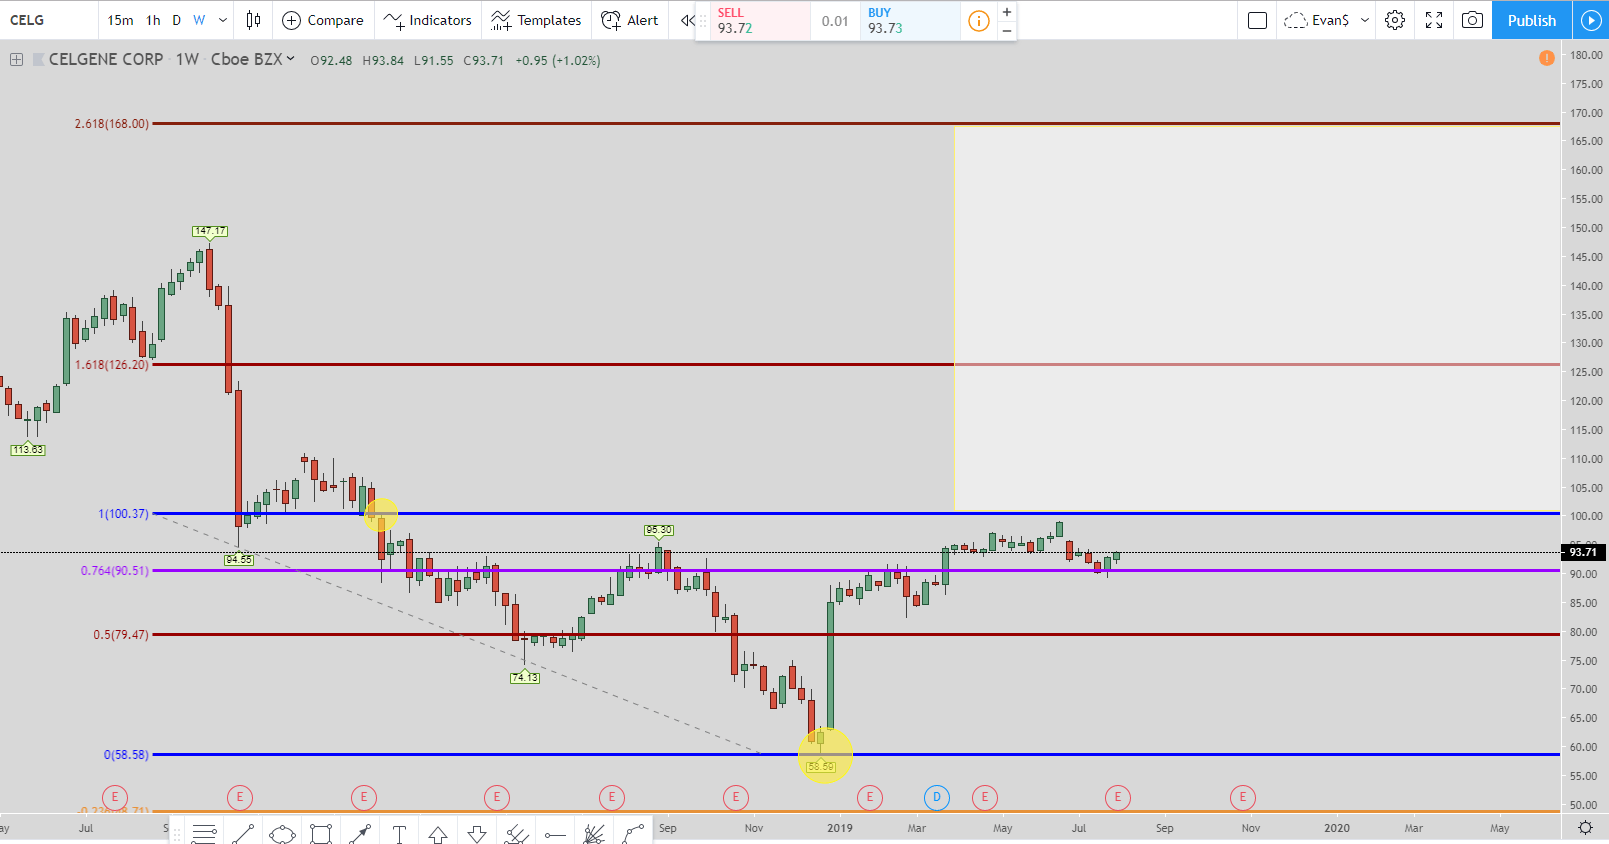
The top of the white box would be the entry and the bottom at the 100% Fibonacci retracement level would be the exit. That exit is around $101. But this only happens if the 76.4% entry to the 50% exit doesn’t get filled or if the 100% entry to the 76.4% exit doesn’t get filled. If either of those exit levels get filled then the setup is over and time to look for another trade.
Video Review for Celgene’s Charts
Conclusion
With the CELG stock being in 2 long setups for different time frames and 1 short setup for another, it leads me to be slightly bullish on the stock.
This is a stock I am putting on my watch list because it does have solid fundamentals that meet most of my growth stock parameters.
All of the setups were ones I found through meditation. When you meditate you will find certain setups and ideas come to you out of nowhere. So what I do is try them all out. Some work while others do not work.
But what it does it get you one step closer each time to find out what trading style and the system works for you. Take control of your trading and quit paying “gurus” thousands of dollars to learn there losing systems and trading rooms that are a ripoff.
You have the power to discover your own system and create your own setups. Each person on earth is unique and therefore no two people will trade exactly the same.
Meditation will not only assist in your trading career but it will help calm your mind and improve other areas of your life. You will be more focused, calmer, and have less anxiety.
I encourage you to meditate, even if it is only 1 minute per day. Make it a habit and eventually that 1 minute will turn into 2 minutes. Then 2 minutes will turn into 5. Before you know it you will be meditating for 30 minutes per day.
I credit just about any success I have had through trading from meditating and trusting my subconscious mind to show me how I need to trade in order to be a successful trader.
Take care,
Evan Carthey
