In this series of day trading setups for maximum profits, I am going to go over the 78.6% trade. All of these posts will be in-depth and provide the theory, precise entries, and precise exits for each of the setups.
This will be a series of posts where I go over all of the setups I am currently using for my trades. I will also go over other setups I have used along my trading journey but am not currently using. The goal is to help assist you in your trading journey. I want you to be able to pick and choose what works for you.
I do not recommend trying to copy these trades exactly how I use them. What I do recommend is seeing how I trade and then picking and choosing what works with you and your trading style.
One of the goals of my trading style is to take as much subjectivity out of my trading as possible. What I mean by that is I want to have the entry and exit defined before I am in the trade.
From there I can monitor and adjust the trade if necessary as the price of the trading instrument moves up or down. This is why my trading style has gravitated towards Fibonacci retracements and extensions. They provide the framework I need to take the guesswork out of my trading.

For over 10 years I read a countless number of trading books, watched hundreds of videos, read thousands of posts on trading forums, and spent thousands of dollars with “gurus” and trading rooms. The only thing I gained from all of it is how to spot someone who is not a profitable trader.
It wasn’t until a friend of mine showed me meditation and how it transformed his trading career. I fought against it for a while but eventually started meditating through his advice once I saw the changes and how profitable he was day trading. I’ll go over more about this in the next section.
If you only take away one piece of advice from this series then it is to meditate. I truly believe I would not be at this point in my trading career if it wasn’t for meditation.
How the 78.6% Trade Was Discovered
In my opinion, the most important aspect of trading is your psychology. How you view the market through your mental makeup will go a long way in determining if you will be a profitable trader. You can try to copy other people’s trading styles and system but it is extremely hard to be a profitable trader by doing this.
The main reason why is because you will not trust how you are trading because you did not create the trading setup. I firmly believe you have to be the creator of your trading setups to truly experience success.
The best way to get there is through meditation.
This setup wasn’t the first one I discovered. That would be my Bread and Butter Trade.
In fact, this is one of the latest setups but it is my favorite. Through my trading journey using meditation, I knew that each setup I discovered would get better and better.
As my trading style continues to evolve then each setup becomes a little bit more profitable. So when you start meditating don’t worry about the setups you will discover that may not work after some back-testing. Each setup that you rule out will take you one step closer to finding your first profitable setup.
It took me over 6 months of meditating and discovering new setups before I found the first one that worked for me. Years later I no longer use it because I have other setups that work better for me.
Your trading will constantly evolve. The more you meditate the better it will become.

The 78.6% Fibonacci retracement level isn’t a true Fibonacci number. It is the square root of the 61.8% number that many people view as the “golden ratio.” Through my meditation and then looking at the charts I saw that the price treated the 78.6% level in a unique way.
There always seemed to be some type of movement when the price hit that level. Even if the price went through the level it always seemed to come back up close to it after a while.
So as I meditated more and started watching the 78.6% level I saw some patterns emerge.
The 78.6% trade can be used for long and short trades that I will go over in another section so read on.
Fibonacci Retracements and Extensions
If you need background information regarding how Fibonacci numbers are created then check out this article from Investopedia. Here are some highlights from it below in the quoted text:
The ratios themselves are based on something called the Golden Ratio.
To learn about this ratio, start a sequence of numbers with zero and one, and then add the prior two numbers to end up with a number string like this:
0, 1, 1, 2, 3, 5, 8, 13, 21, 34, 55, 89, 144, 233, 377, 610, 987…
The Fibonacci extension levels are derived from this number string. Excluding the first few numbers, as the sequence gets going, if you divide one number by the prior number, you get a ratio approaching 1.618, such as dividing 233 by 144. Divide a number by two places to the left and the ratio approaches 2.618. Divide a number by three to the left and the ratio is 4.236.
The 100% and 200% levels are not official Fibonacci numbers, but they are useful since they project a similar move (or a multiple of it) to what just happened on the price chart.
The reason why I like Fibonacci numbers and their derivatives is that you see them throughout the universe. They have intrigued me for a long time and I gravitated towards them in my trading.
As I mentioned before I am looking to take as much subjectivity out of my trading and Fibonacci retracements and extensions help me do this. You have to pick and choose what interests you in your trading journey.
For me, the cornerstone is the Fibonacci retracements and extensions. At the end of the day, you want to use what works for you. Hopefully, this article will show you how the Fibonacci levels assist me in my trading.
The first step is you need to have a couple of Fibonacci retracement numbers and at least one Fibonacci extension numbers. Here they are:
Fibonacci Retracement:
- 50%
- 78.6%
- 100%
Fibonacci Extensions:
- 423.6% (Not necessary but I like to have it included)
- 261.8%
- -123.6%
From the Fibonacci retracement levels the 50% and 78.6% are not true Fibonacci numbers but for the sake of this setup that is what I am calling them. The 78.6% is the square root of the 61.8% and the 50% is just there because a ton of people use it and it is one I use as well.
The reason why I use the -123.6 level is that it is going the opposite way and is easier to have it all in one drawing. You will see why later in this post why I use it.
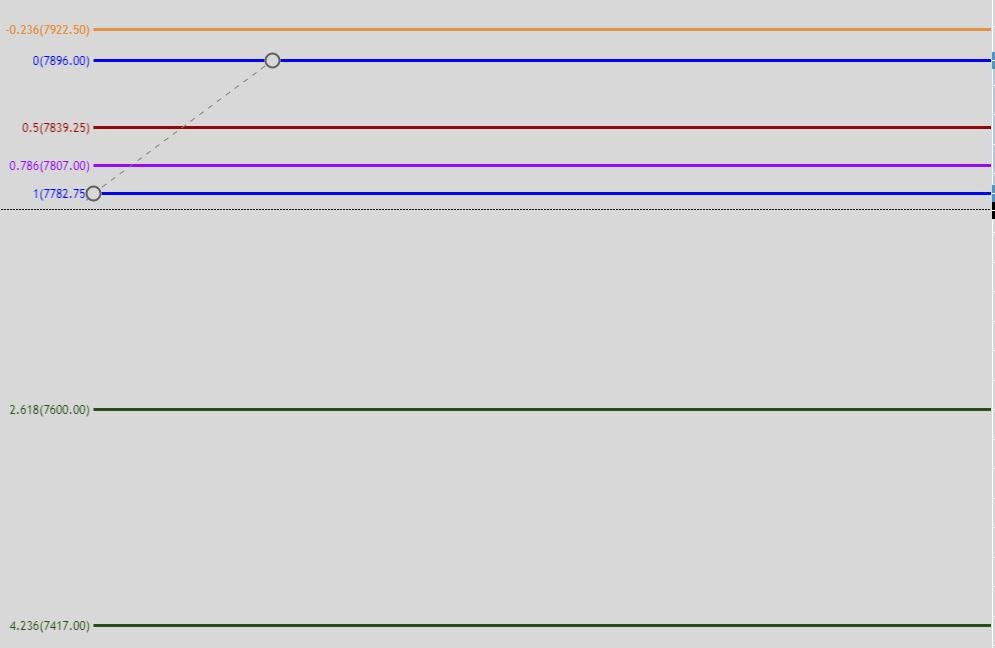
So after you get them setup then your Fibonacci drawing should look something like the chart above. I use TradingView for my charts when I trade futures and stocks. I use MetaTrader 4 for Forex but all of these examples will be using TradingView.
You can just use the free version. That is what I use.
The Setup and Trading Rules
Here are the entries and exits:
- Entry 1: When the price hits the 78.6%
- Exit 1: When the price hits the 50%
- Entry 2: If the price does not hit the 50% exit but goes on and hits the 100%
- Exit 2: The 78.6%
- Entry 3: If the price does not hit the 78.6% exit but goes and hits the 261.8%
- Exit 3: The 100%
Now before you just start drawing Fibonacci retracement levels all over the place there are a couple of rules for the setup to be valid (assume this is a long/buy setup):
- The price has to retrace to the 78.6% level
- The price then must go up and hit the 123.6% level
- After those criteria are hit then you keep the original anchor point low
- You then move the anchor point high to the anchor point high. Once the price retraces back and hits the 78.6% level then that is your 1st entry
In the charts and video below, it will make more sense once you see them in action.
Please remember that once an exit is hit then the move is over. You do not continue to get into the trade if an exit level is hit. Once setup is over and it is now time to look for another setup.
Another item to note is I almost always have my exits slightly lower than the exit. The reason why is I want to ensure I get filled and get out of the trade.
I have seen the price go up and barely hit/tick the hard exit level at the Fibonacci level that does complete the setup but there would not have been enough volume to get you out of the trade.
A Simple Trick
One trick I’ve found when I was using the Bread and Butter trade is to look for a trend line break. This can signal the move is almost over or at least weakening.

One other thing to keep in mind is that many times after a trend line break the price will go back and use the former resistance as support. Do you see in the chart above how it did this?
This isn’t a trading rule you must follow for the 78.6% trade but it can help you get in at a better price if you wait for a trend line break when there is a deep retracement to the 261.8% or the 423.6%.

Here is the setup. The bottom yellow circle is the anchor point low. The top yellow circle is the anchor point high. Then you can see the retracement to the purple line which is the 78.6% level that I highlighted with the yellow box. Finally, the price moves up and hits the orange line which is the 123.6% Fibonacci extension level.
Once all of that happens then we have ourselves a potential 78.6% trade setup. Let’s see what happens next.

Next, you take the previous anchor point high and move it up to the top of the move. I highlighted it with the top yellow circle. From there we wait until the price retraces back to the 78.6% setup.
It did this where the green box is located. When the price hit the purple line then the exit was the top of the green box which is also the 50% level.
But as you can see the price continued to move lower without hitting the 50% level so that is when the 100% level gets hit. Once that does then the exit moves to the top of the blue box which is the 78.6% level. So as you can see the exit is currently at the top of the blue box (the 78.6% level). Let’s see what happens next.

Here you can see from the chart above that the price continued to move lower and hit the 261.8% level (the green line). Once this happens then the exit moves to the top of the blue box which is the 100% level.

This is a trade that I am currently long in. The price has started to move back up and is getting closer to hitting the 100% line but still has a little bit more to go. So this is what I look for when I am using the 78.6% trade. A deep retracement to at least the 261.8% level.
Once that happens then the exit does not move again, even if the price continues to move lower than the 261.8% level. The price does do this, that is why I also have the 423.6% Fibonacci extension level because I will usually look to get in there as well.
Please see the video below for more setups and explanations about the 78.6% trade. This setup can be used for day trading, swing trading or any time-frame you want to use. In the charts above I am using the 15-minute chart because that is normally what I use for my futures trades. But I also use this on the daily time-frame and 1-hour as well when I am trading stocks, Forex, and cryptos.
So whatever time-frame you want to use will work with this setup. So far the lowest time-frame I have used this on is the 5-minute chart for day trading because anything faster than that moves too much and too fast for the way I like to trade.
Video for the Day Trading Setups for Maximum Profits: The 78.6% Trade
If you cannot view the video then click on this sentence to be taken to it.
Conclusion for the Day Trading Setups for Maximum Profits: The 78.6% Trade
The way I utilize the 78.6% trade is I normally wait until the retracement to at least the 261.8% level. Sometimes even to the 423.6% level.
The reason why is unless you have a very large account there can be a decent drawdown until the price moves back in your direction. This means that I miss out on plenty of trades where the 78.6% hits the 50% or the 100% hits the 78.6%.
But when I exercise patience (something I struggle with) then the rewards for this setup are immense. Please remember that I usually get out sooner than the hard exit on the Fibonacci line. I always make sure I get out a little early in order to ensure my exit gets filled.
As my account grows then I will look to get in sooner but right now I am usually looking for at least a 261.8% retracement in order to get in.
So hopefully the charts, explanation, and video show the way I utilize this setup for my trades. This is a setup I am currently using in my trading journey.
There are two other setups I use that I will write about in future blog posts. They are the Springboard trade and the 823.6% trade. They can be used in day trading or in any other time frame as well.
