There is a triangle pattern that is easier to spot than most and you can actually do it in real-time when it matters. There are other triangle patterns in the trading world which in theory are easy to spot but when you are trading live they seem to only work after the move has taken place.
Ascending, descending, and symmetrical seem to be the three most popular triangle patterns based on the articles I searched online.
But the one I found which works for me is the expanding triangle or also known as the broadening triangle.
The expanding triangle trade is nothing new, it has been around for a long time. I have figured out how to make it work for me which is what I am sharing with you.
If you are looking for a primer on triangles then this link provides a good background on what they look like and how they work:
https://investorplace.com/2009/04/technical-analysis-101-triangles/
Another Confusing Elliot Wave Theory Pattern?
The Elliot Wave Theory has always been intriguing to me but I could only spot the setups after they completed which did not help me at all. I’ve read a couple of books about the Elliot Wave Theory and have watched numerous videos but I still was not able to use it in real-time to make money trading.
From this website: http://stocata.org/ta_en/elliott6.html look at all of the rules they have regarding how to trade a triangle:
Rules and Guidelines for the Triangle
- Wave A is a simple, double, or triple zigzag pattern, or a flat correction.
- Wave B is a simple, double, or triple zigzag pattern.
- Waves C and D can be any correction pattern, except a triangle.
- Waves ABC and D remain within or close to the triangle channel.
- The triangle is closed after wave E.
- The triangle lines converge; they cannot be parallel lines.
- One of the sides of the triangle can be a horizontal line.
- Wave E is a simple, double, or triple zigzag pattern, or a triangle.
- Wave E has a smaller price move than wave D, but it moves more than 20% of D.
- Either wave A or wave B has the biggest price move.
- Wave E ends in the range of wave A.
- Wave E ends within or close to the BD line.
Rules and Guidelines for the Inverted Widening Triangle
- The five waves have a simple, double, or triple zigzag pattern.
- Wave B is smaller than wave C, but a minimum 40% of wave C
- Waves ABCD move within or close to the lines AC and BD.
- Wave C is smaller than wave D, but a minimum 40% of wave D.
- Wave A moves within the line AC.
- Wave A starts after the starting point of the inverted triangle.
- The channel lines of the inverted triangle diverge; they cannot be parallel lines.
- None of the channel lines can move horizontally.
- Wave E is bigger than wave D, but wave D is a minimum 40% of wave E.
- Either wave A or wave B has the smallest price move.
- Wave E ends in the range of wave A.
- Wave E ends within or close to the BD line.
I am sure some people use the Elliot Wave Theory to make money trading because I’ve never met anyone who does so.
But the structure it provides is very interesting for trading which is appreciated.
At the end of the day, the goal is to make money trading and I couldn’t find a way to make the Elliot Wave Theory work for me (that doesn’t mean it won’t work for you).
I try to keep my trading as simple as possible. When you day trade futures you have to be able to spot setups on the fly which is why I try to keep my setups easy to spot.

So with the expanding triangle setup, I have been able to see when the formation is forming so I know when to take or avoid the trade.
You basically just look for higher highs and lower lows while counting to 5.
You will see the way I trade that I incorporate Fibonacci extensions as well as the Schiff Pitchfork in order to help show me what the move is looking to do.
The way I trade it is a way that works for me. I highly doubt it falls within the proper rules of the Elliot Wave Theory with the counts and how high or low the waves can go.
How I discovered this setup was through meditation. That is how I have discovered all of the setups that have worked for me and each setup I discovered works better than the previous setup.
They become refined over time.
What is the Expanding Triangle Pattern?
Simply put, an expanding triangle is simply a 5 point move where each point makes a higher high or lower low depending on what direction you are looking to trade the setup.
It basically looks like a megaphone. The trend lines start out small and then widen as higher highs and lower lows are created.
I’ve read some articles where it is a bearish setup but in my trading, that is simply not true. It works just as well for bullish setups as it does for bearish setups.
So I use it to trade either way and you’ll be able to see why and how in this article.
The expanding triangle is a setup where at each swing point a higher high or lower low is made.
Look at the picture below:

I labeled the 5 points. This setup for point 5 would eventually be a short setup. If you took the trade at point 4 then it would be a long setup.
The way I trade is you can take the trades from point 4 or 5 that I will go over in the next section.
Hopefully, you can see that point 3 is a higher high.
Point 4 is a lower low and point 5 is a higher high.
The key point for an expanding triangle is volatility.
Between points 3, 4 and 5 you will a lot of the time see abrupt and big moves as the higher highs and lower lows are created.
That is why they became easy to spot for me.
How to Trade the Expanding Triangle
The only main rule I have for trading the expanding triangle pattern is that a higher high or lower low must be made for the swing to be valid.
From there I use Fibonacci retracement and extensions to generate my entries and exits. I do not use (at the time of this writing) any oscillators or moving averages.
I also use the Schiff Pitchfork but that is mainly used for the extreme moves that I will talk about as well.
For the entries, I enter at the 127.2%, 161.8% and the 178.6% Fibonacci extension levels.
My stop loss is just above or below (depending on if going long or short) the 200% Fibonacci extension level.
The profit target is at the 23.6% Fibonacci retracement level but I can, of course, take profit at any time. But I will move it to the 50% Fibonacci retracement level of the move I am measuring based upon what the price action is doing.
The move is officially over when price retraces back to the 50% level after the 5th point has been established (which also can be my profit target).
The price can, of course, go much lower or higher than the 50% but that is the barometer to signal to me that the move is over.
I use this on points 3-4 and of course on points 4-5, let me explain through the pictures below.
Trade Example Number One
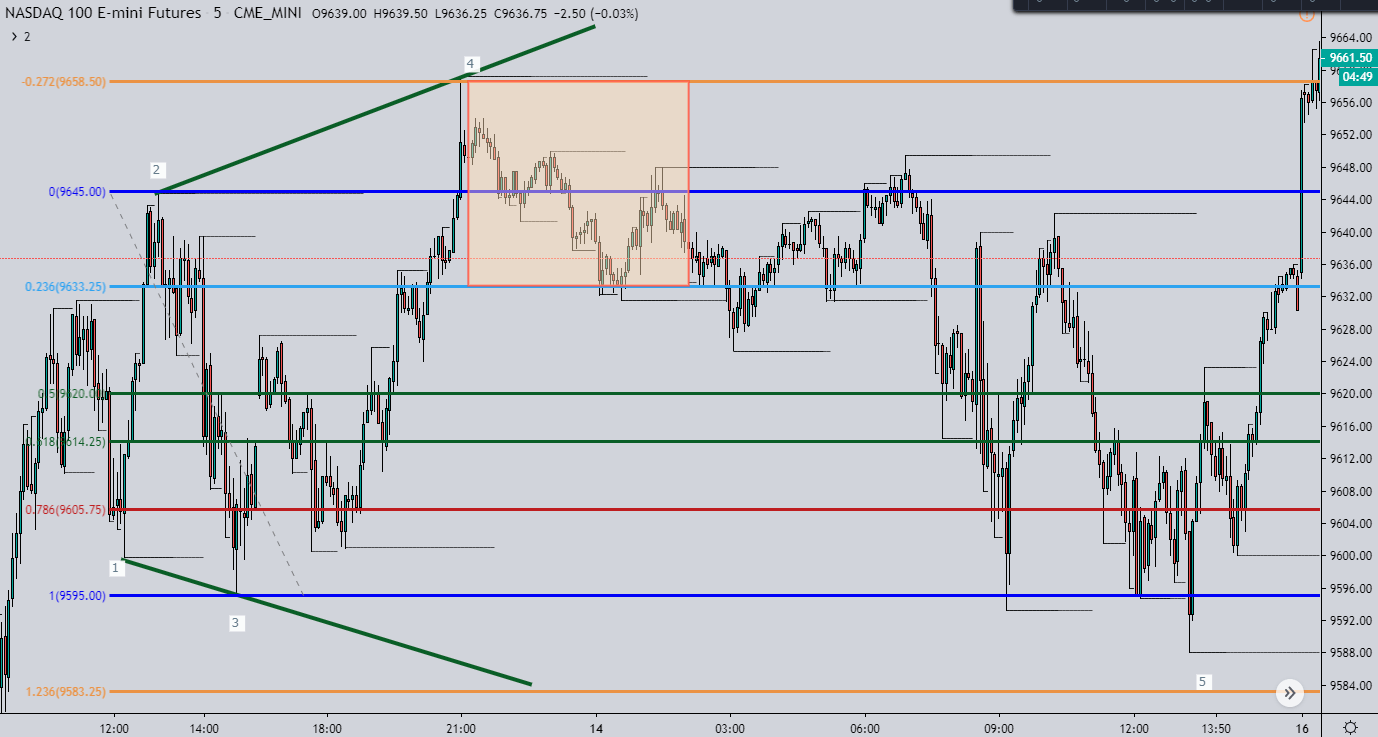
Here the box highlighted in red represents where I would have entered at the top of the box when the price hit the 1.272% Fibonacci extension level.
The exit is the bottom of the box at the 23.6% level. This would have been a very nice trade.
You can see a lot of profit was left on the table but based upon how I trade and what I am comfortable with using risk to reward, the 23.6% exit works for me.
So that was measured from points 2 to 3 to get point 4. That does not complete the Expanding Triangle formation.
The formation is only complete (according to my rules) when point 5 is established and then retraces to the 50% Fibonacci retracement level.
As you can see from the picture above, the price did make the 5th point and then retraced to a 50% level so that the setup is done. I would not have been able to enter because point 5 would not have gone low enough to hit my entry at the 127.2% Fibonacci extension level. It is not drawn on the chart above because it is obvious to see how point 5 did not go low enough compared to point 3 to hit the 127.2% level.
Trade Example Number 2

In this example, I am trading off of the 5th point in the expanding triangle setup. This is where the 50% has to be hit for the move to be complete.
The highlighted box in blue represents the 50% – 61.8% level with the 50% being the top.
You can see how the 23.6% Fibonacci retracement level is close to 50% of the retracement level so it just depends where I have my exit. For the 5th point trade, it is usually on the 50%.
For a 4th point trade, it is usually on the 23.6% since we can expect on average a bigger move from point 4-5 than from 5 -? (because the 5th move is complete at the 50% so we don’t expect it to go to a certain point like the point move from 4 to 5).
In this trade, the price went up through the 127.2% which would have been the 1st entry.
The price then went up through the 1.618% level which would have been the 2nd entry.
Finally, the price went through the 1.786% level which would have been more than enough to get us in for the 3rd entry.
The stop loss would have been just above the top bright red line which is the 200% Fibonacci extension level.
But as you can see the 1.786% level was the turning point for this trade. The price hit it and then soon started its descent down to where it made a huge gap down to complete the trade by hitting the top of the blue box which is the 50% retracement level from points 4 – 5.
In this setup, my exit would have been around the 50% retracement level (the top of the blue highlighted box).
Obviously this setup does not work 100% of the time. That is why I have the stop loss in there. If it gets hit then time to look for the next setup.
Video of the Expanding Triangle Pattern
If the video does not load below then CLICK HERE to be taken to it.
Putting It All Together
The expanding triangle pattern popped out to me one night while I was reviewing the charts that were in-between meditating sessions.
At first, I noticed the symmetrical triangle and looked to see if I could make that setup work for me but soon I noticed the expanding triangle. It kept on popping up over and over again and was easy for me to spot.
From there I started playing around with it and soon discovered the entry and exit levels I needed to make this setup work for me.
It doesn’t work 100% of the time which is why I have a stop loss in place but from what I have seen from my early testing it works more than 70% of the time.
With my risk to reward at a minimum of around 1.2 – 1 then I only need it to work a minimum of 50% of the time to be in profit long term.
But even when the expanding triangle pattern doesn’t work if the trade is for point 5 then there are still two potential trade setups from this failed point 5 retracements.
I’ll cover those in another post but each of those setups from the failed Expanding Triangle Setup does provide the opportunity for high percentage trade setups that utilize the Schiff Pitchfork.
The key to discovering new setups is of course to meditate. Then continue to analyze the charts until setups pop out to you and that is when you can start seeing what works and what doesn’t work for you.
Meditate, analyze and then adjust. Those are the 3 steps I use to create the setups that work for me.
