The American Water Works stock is another stock at the moment that would have been a great investment if you purchased anytime since October 2018. At its lows then it was around $90. Currently, AWK sits at around $115. With a dividend of 1.74%, it has made a very nice move over the past 8 months.
We will take a look at the fundamentals of the stock and see if we can consider it to be a growth stock based upon the 7 markers I look for. We will also look at the technical setups based upon the setups I use to trade in order to see if there are any long or short trades currently available.
American Water Works provides clean, safe, reliable, and affordable water services. AWK is the largest and most geographically diverse US publicly traded water and wastewater utility company. They were founded in 1886 and are based in Camden, New Jersey with 7,100 employees.
Fundamental Analysis of AWK
There are 7 fundamental markers I look for in a stock. I try to only purchase growth stocks so these are the parameters I look for to see if a stock meets the majority of the markers. I prefer to have all seven fulfilled. You can it more in depth here: https://evancarthey.com/how-to-scan-for-winning-stocks-an-insiders-view-to-my-process/
- Market Cap: > $300 million
- EPS growth past 5 years: >0%
- P/E: Over 10
- EPS growth next 5 years: >0%
- Sales growth past 5 years: Over 20%
- Debt/Equity: <0.1
- Sales growth qtr over qtr: Over 5%
Does the stock meet these 7 markers?
- Market Cap: 20.83B (YES)
- EPS growth past 5 years: 9.20% (YES)
- P/E: 35.45 (YES)
- EPS growth next 5 years: 8.20 (YES)
- Sales growth past 5 years: 3.60% (NO)
- Debt/Equity: 1.49 (NO)
- Sales growth qtr over qtr: 6.80% (YES)
I used Finviz.com for the fundamental analysis screener.
Technical Analysis for the American Water Works Stock
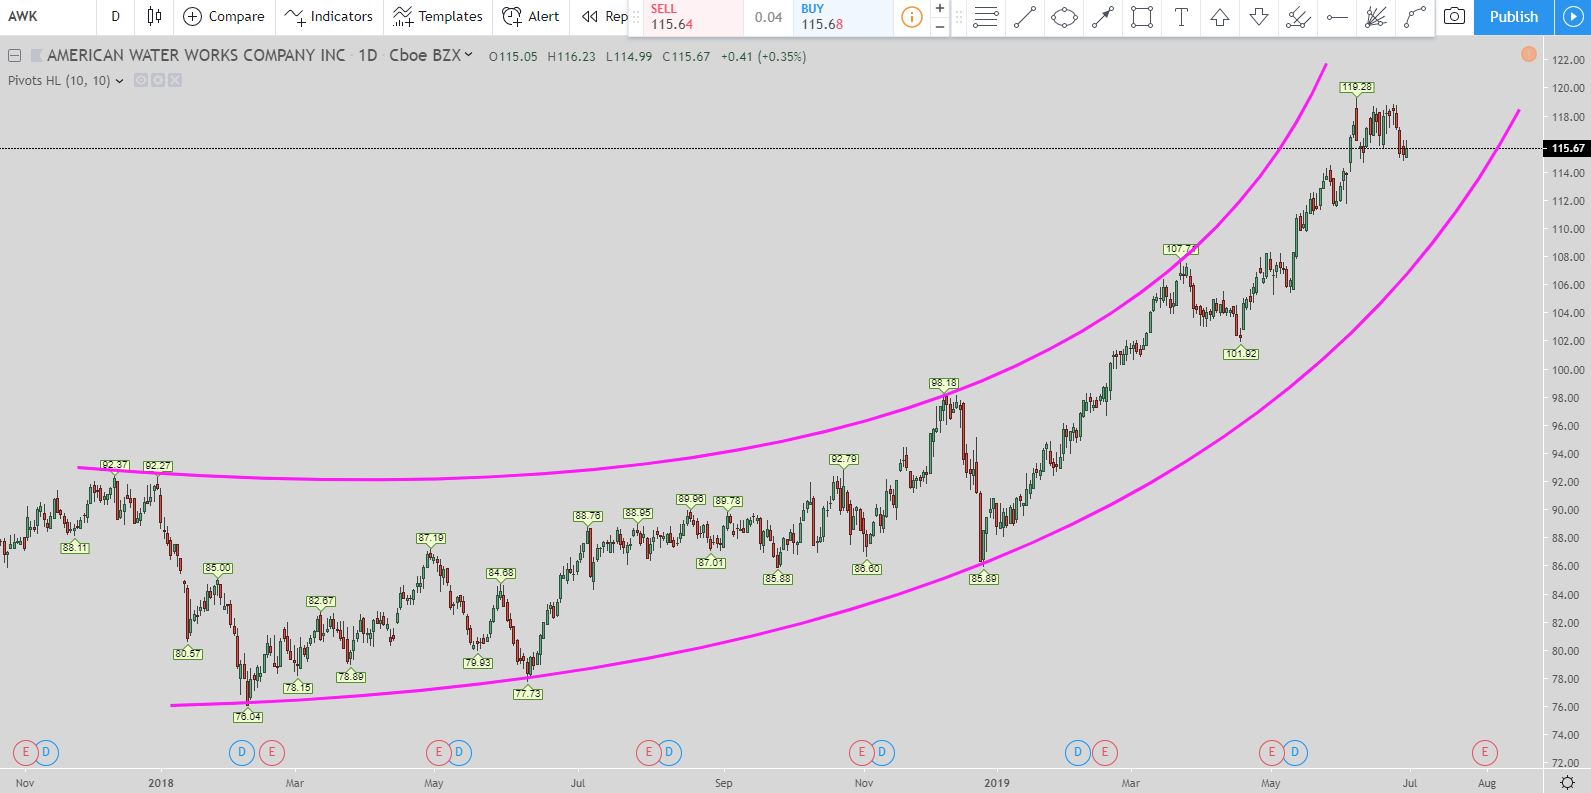
AWK is another stock that is in a parabolic curve. The tricky part when you draw lines on the chart is they can be very subjective. With the way, I drew this parabolic line I increased the bottom line to the max to be safe.
When the price breaks that line then I am confident in saying that the retracement will happen. You can see the line I drew on the top side so you can get a better feel for the channel it is currently in using the daily chart.
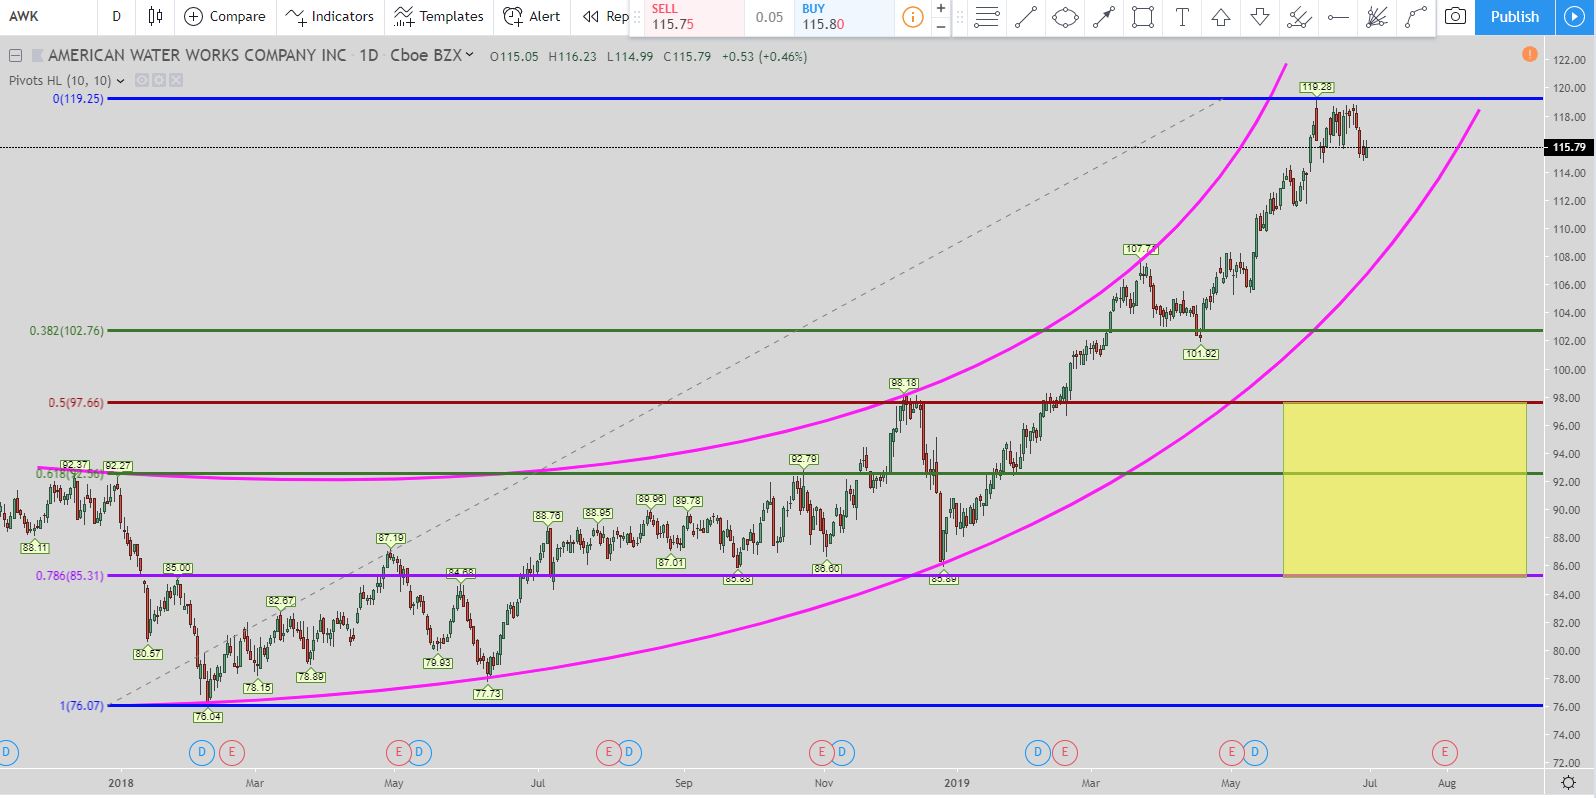
Here you can see the exit levels the price would be looking for when it breaks out of the parabolic curve. The red line at the top of the yellow box is the 50% Fibonacci retracement level. The purple line at the bottom of the yellow box is the 78.6% retracement level. The 50% level is around $97.50 and the 78.6% is around $85.50.
Those are the exit levels once the parabolic curve breaks. Of course, the price could go much lower but those are the two levels to look at after the break.
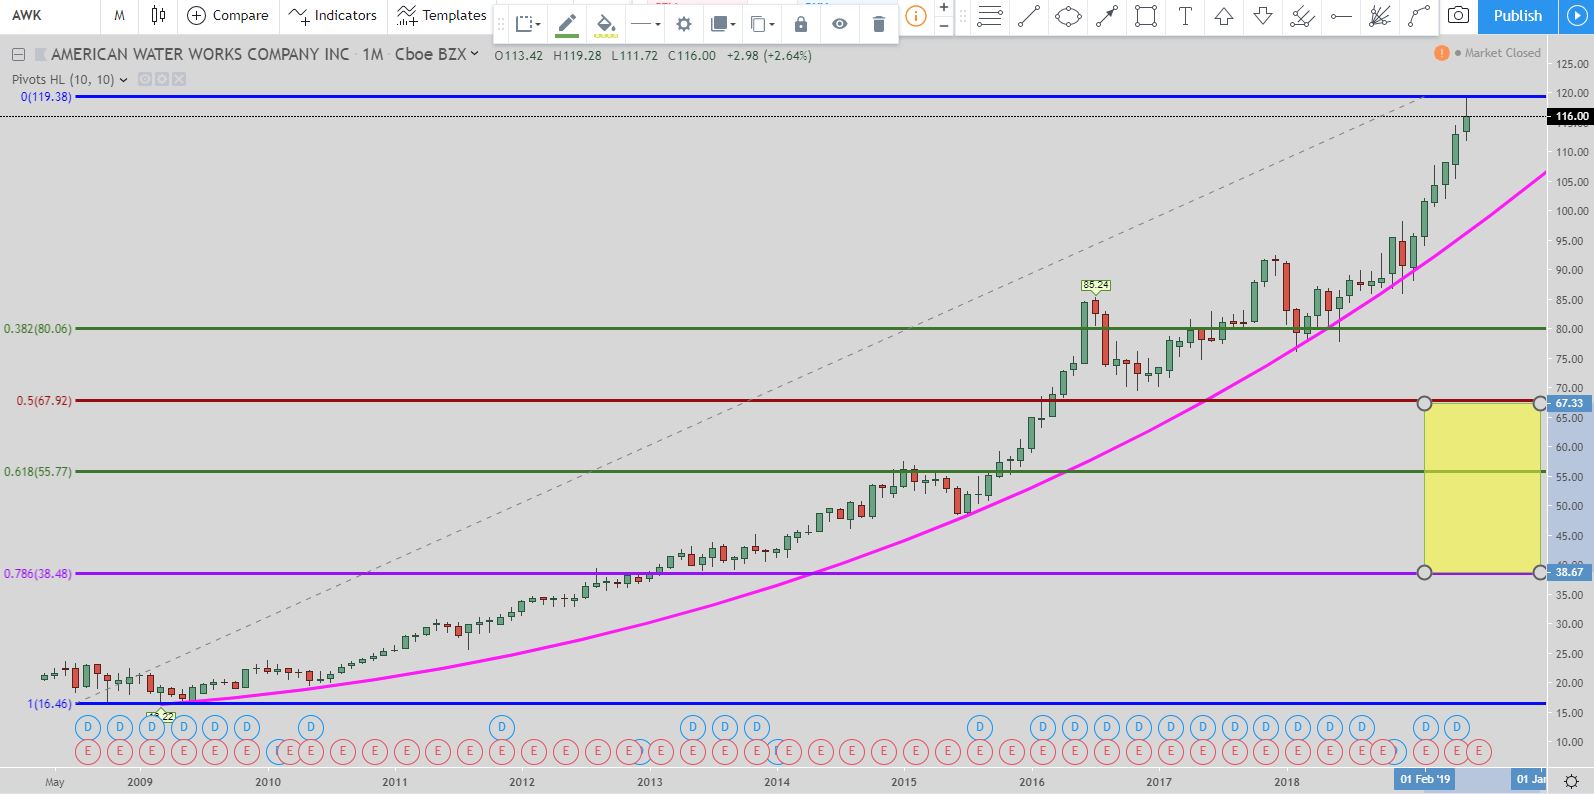
Here is another parabolic curve using the monthly chart. I put in the yellow box again. The top is the 50% retracement and the bottom is the 78.6%. If a new high is made then the levels will move up with it.
As you can see the stock has done amazingly well over the years. Eventually, the parabolic line will break but I would wait until you have a firm confirmation of the break before even thinking about shorting.
The other setups I use are not in play because I need volatility for them to be activated. So far this stock is so far out front that there isn’t enough volatility for my other setups to even be watched. There was one on the 1-hour chart that was completed a little bit ago just like the stock I reviewed the other day.
American Water Works Stock Forecast
AWK is a stock that has been doing exceedingly well over the past several years. The fundamentals do not meet all 7 of the markers to be considered a growth stock but that has not stopped it from moving up very well. It also has a dividend so if you are thinking of a long term buy and hold then it could be an option.
I would not short this stock until it broke out of the parabolic curve. In fact, you could almost buy now and only get out once it closes outside of the parabolic curve. That probably won’t happen soon so it might be an option to consider.
Yesterday I reviewed American Tower Corporation’s stock and it is very similar to American Water Works stock. Both are in a parabolic curve and based upon my other trade setups the only thing I can do right now is waiting for it to break. Or wait for volatility to come into the stock for my setups to initiate.
The parabolic curve is a setup I really like. The one thing to keep in mind is it is to be safe than sorry with it. What I mean by that is it is better to extend the upper part of the curve out as far as possible so you can be sure the curve is actually broken. You don’t want to get in too early when shorting a stock using the parabolic curve.
Once the parabolic curve truly breaks it usually goes down a little bit and then rises up again. That is when it is safest to short the stock. Waiting for the pullback after the break is what I like to see.
Popular Links
Here are a couple of links if you are looking at how I view the market and with my trade setups as well as products I like and use.
- How to become a profitable trader using meditation
- How to scan for winning stocks
- Bread and Butter Trade
- How to Improve Your Meditation with the Brain Evolution System
- Review: Stikky Stock Charts – An Excellent Trading Book That is Interactive
Robinhood Trading Broker Review
If this post benefits you and if you haven’t used Robinhood for trading stocks but are thinking to then please consider using my referral link when you do sign up: http://share.robinhood.com/evanc203.
This way each of us will receive a free share of a random stock if you sign up through my referral link.
My Robinhood Review: https://evancarthey.com/review-robinhood-trading-service-with-no-fees-part-1/
