Today we will be looking at the American Tower Corporation stock (AMT). In looking at the chart it has been in an amazing uptrend since October 2018. It has gone from around $140 to currently around $205. The company is the owner and operator of wireless and broadcast communications infrastructures in several companies with their headquarters in Boston, MA. Here is their website: https://www.americantower.com/index.html
Their vision is to make wireless communication possible everywhere. With the way the world is now, it seems they are in the right spot at the right time so this should be pretty interesting. It’s not like they are a brick and mortar company who all seem to be going bankrupt. That obviously isn’t true but we are definitely seeing a shakeout from companies who were unable to adapt to how consumers changed their purchasing habits. That is a good thing. Competition brings change and improves the marketplace for the consumer.
This is off of its high of around $220 earlier this month. We will look at the growth markers from the stock’s fundamentals to see if it can be considered a growth stock. You will also see the technical analysis and how it relates to the AMT stock price.
Finally, we will finish with the AMT stock price forecast for what I think is next for the American Tower Corporation stock. All of this is based upon the setups I personally use for my trading.
I have no plans to own AMT in the next 48 hours and I do not currently own the stock.

Fundamental Analysis for the American Tower Corporation Stock (AMT)
There are 7 fundamental markers I look for in a stock. I try to only purchase growth stocks so these are the parameters I look for to see if a stock meets the majority of the markers. I prefer to have all seven fulfilled. You can it more in depth here: https://evancarthey.com/how-to-scan-for-winning-stocks-an-insiders-view-to-my-process/
- Market Cap: > $300 million
- EPS growth past 5 years: >0%
- P/E: Over 10
- EPS growth next 5 years: >0%
- Sales growth past 5 years: Over 20%
- Debt/Equity: <0.1
- Sales growth qtr over qtr: Over 5%
Does the stock meet these 7 markers?
- Market Cap: 91.98B (YES)
- EPS growth past 5 years: 14.90% (YES)
- P/E: 67.83 (YES)
- EPS growth next 5 years: 21.77 (YES)
- Sales growth past 5 years: 17.20% (NO)
- Debt/Equity: 3.97 (NO)
- Sales growth qtr over qtr: 4.10% (NO)
I used Finviz.com for the fundamental analysis screener.
With the American Tower Corporation stock only hitting 4 of the 7 growth parameters I cannot consider this a growth stock. But when we look at the charts you’ll see it hasn’t cared about my silly growth stock parameters.
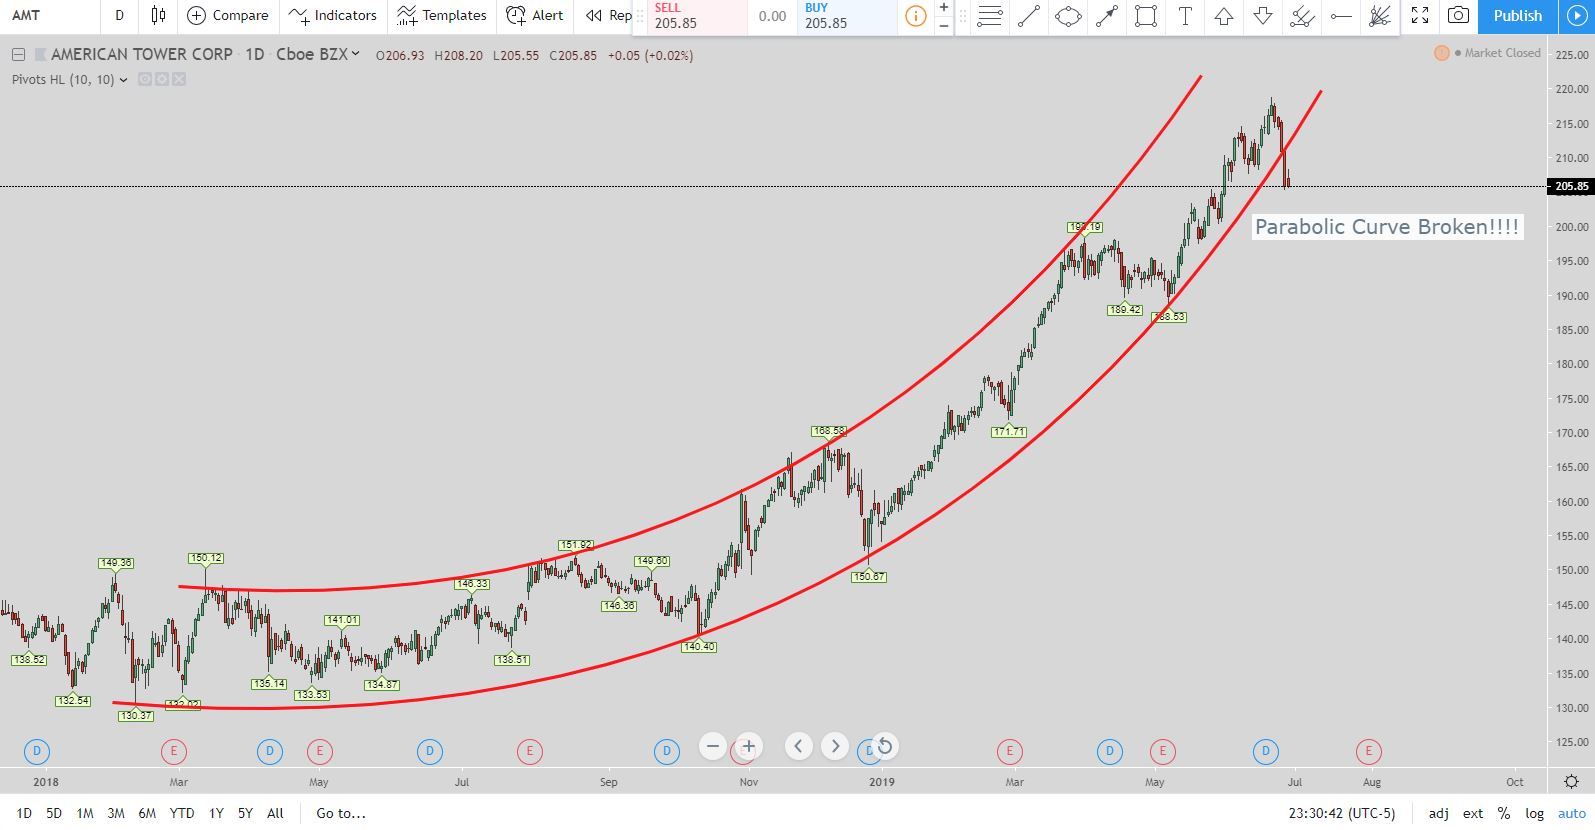
AMT has gone from around $140 in October 2018 to near a high of $220 this past June 2019. We’ll dive into the technical analysis in the next session and you will see the super strong uptrend channel the stock is in.
Overall the growth markers for the stock are not very bad. The Debt/Equity is pretty high but the rest of them are pretty good.
The sales growth the past 5 years came in at 17.20% which is just under the 20% I look for. While the sales growth quarter over quarter came in around 4% which is just under the 5% threshold. So really it was very close to meeting 6 of the 7 parameters so that is something to keep in mind. Fundamentally when looking at AMT from a growth perspective the numbers are pretty good.
AMT Stock Technical Analysis – The Parabolic Curve

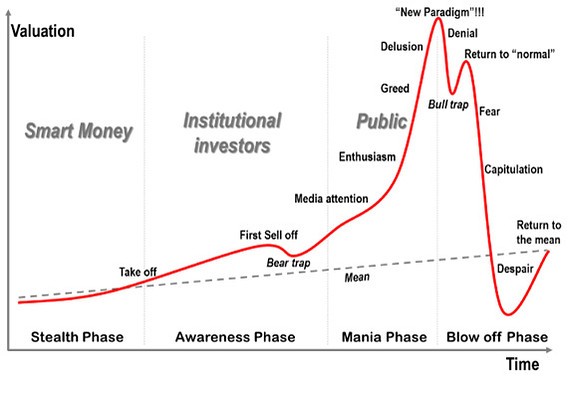
The chart above is one that you see pretty often. The most famous recent one was Bitcoin‘s rise to around $20,000 before the big shake out. This chart for AMT seems to be shaping up the same way.
This chart formation is called a parabolic curve. What that means is the stock is going up in a very fast fashion, hence the term parabolic. But when price breaks out of the curve then you can expect a deep retracement. This chart time frame is monthly so it definitely could stay in this curve for years to come.
But when it eventually breaks out of the curve then look out! Because the stock is going to drop and if you own the stock you want to sell and get out.
The safest way to play this setup would be to buy when the price is brushing against the lower line. But if price closes below the line then get out! You still should be able to get out when the parabolic curve breaks based upon the emotions involved with the parabolic curve for the chart I will put below.
In the daily chart above you can see how the price has broken out of its parabolic curve. Typically when this happens the retracement can be as deep as the 78% Fibonacci retracement level.
Most of the time the stock retraces at least to the 50% Fib retracement level.
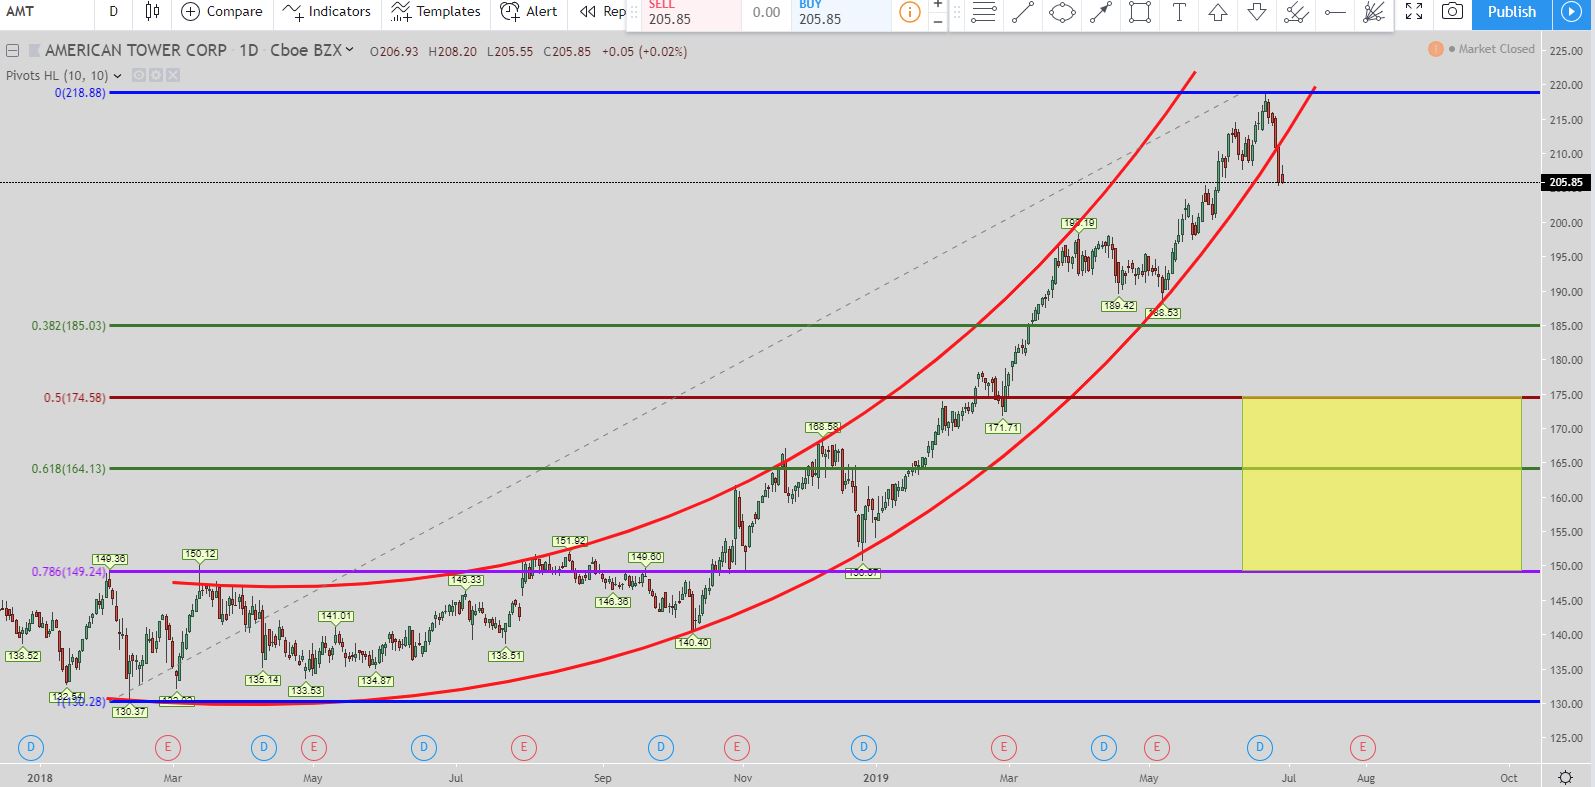
You can see how the fibs show the level we are looking for. The top of the yellow box at $175 is the 50% Fibonacci retracement level. The bottom of the yellow box around $150 is the 78.6% Fib retracement level.
If the parabolic curve holds true to form then we can be looking at a retracement to at least $175.
AMT Stock Forecast
Overall the American Tower Corporation stock has been on a parabolic move up since about 2003 using the monthly chart. It is still well within the parabolic curve using the monthly chart so a breakdown isn’t imminent.
But if you look at the daily chart you can see how the price has broken out of its parabolic curve. This can signal a retracement has started. You can see the 1st exit I have for the retracement being the top of the yellow box at 50%. The second is the 78.6% line which is the bottom of the yellow box.
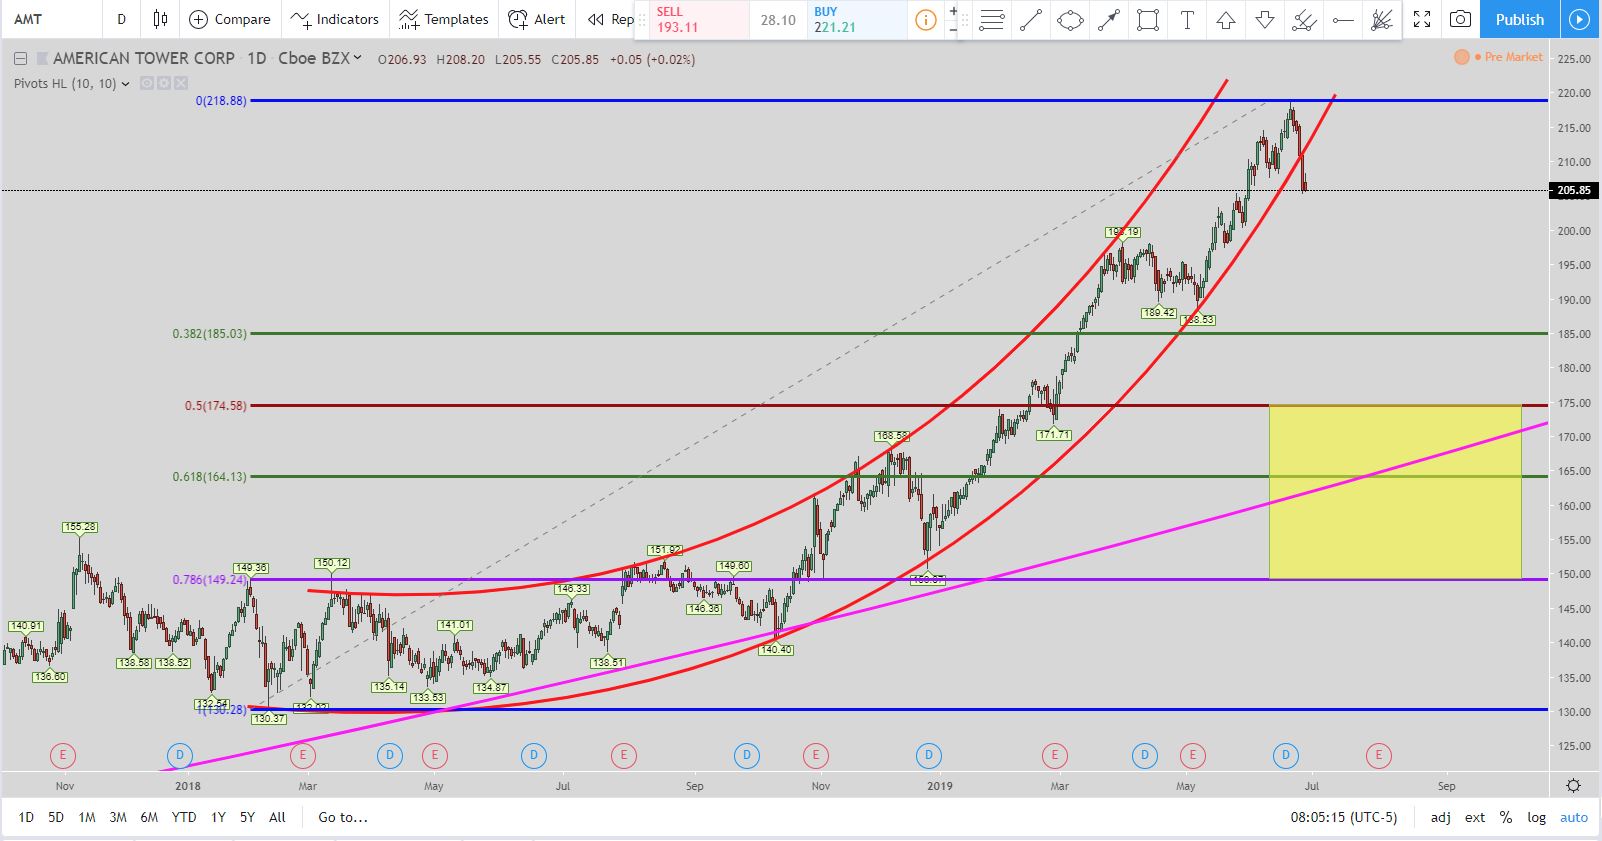
Here is the daily chart with the monthly parabolic curve included. You can see the pink line is the monthly parabolic curve. So this shows that price could easily hit the 50% retracement (the top of the yellow) box for the daily chart and still stay within the monthly parabolic curve time frame.
It looks like there is downside for the near to medium term for the American Tower Corporation stock.
Popular Links
Here are a couple of links if you are looking at how I view the market and with my trade setups as well as products I like and use.
- How to become a profitable trader using meditation
- How to scan for winning stocks
- Bread and Butter Trade
- How to Improve Your Meditation with the Brain Evolution System
- Review: Stikky Stock Charts – An Excellent Trading Book That is Interactive
Robinhood Trading Broker Review
If this post benefits you and if you haven’t used Robinhood for trading stocks but are thinking to then please consider using my referral link when you do sign up: http://share.robinhood.com/evanc203.
This way each of us will receive a free share of a random stock if you sign up through my referral link.
My Robinhood Review: https://evancarthey.com/review-robinhood-trading-service-with-no-fees-part-1/
