American International Group Stock: Will It Protect You?
American International Group stock (AIG) is a company that has gone up from around $38 in December of 2018 to around $54 in about 6 months. It looks to be in a very strong uptrend channel right now. We will look at the stock and see if it will protect you like their insurance.
We will look at the fundamentals based on my growth stock parameters.
We will also look at the technical side based on my technical analysis and the way I trade to see if there are good opportunities to either buy or sell the stock.
Their phrase is “For nearly 100 years we’ve prepared you for what’s next in your life.” If they are going to be around for the next 100 years then this could be a very safe stock to look at for a long-term play that I will talk about below.
American International Group Stock (AIG): Fundamentals
There are 7 fundamental markers I look for in a stock. I try to only purchase growth stocks so these are the parameters I look for to see if a stock meets the majority of the markers. I prefer to have all seven fulfilled. You can it more in-depth here: https://evancarthey.com/how-to-scan-for-winning-stocks-an-insiders-view-to-my-process/
- Market Cap: > $300 million
- EPS growth past 5 years: >0%
- P/E: Over 10
- EPS growth next 5 years: >0%
- Sales growth past 5 years: Over 20%
- Debt/Equity: <0.1
- Sales growth qtr over qtr: Over 5%
Does the stock meet these 7 markers?
- Market Cap: 45.96B (YES)
- EPS growth past 5 years: -63.40% (NO)
- P/E: N/A
- EPS growth next 5 years: 49.51 (YES)
- Sales growth past 5 years: -7.20% (NO)
- Debt/Equity: 0.59 (NO)
- Sales growth qtr over qtr: 6.30% (YES)
I used Finviz.com for the fundamental analysis screener.
Based on the fundamental markers I cannot consider the American International Group stock a growth stock. Although if you purchased the American International Group stock in December 2018 you would highly disagree!
Their Debt/Equity isn’t bad and it does look like they have some growth potential but they do not meet the 7 out of 7 markers I look for to consider them a growth stock.
Technical Analysis for the American International Group stock
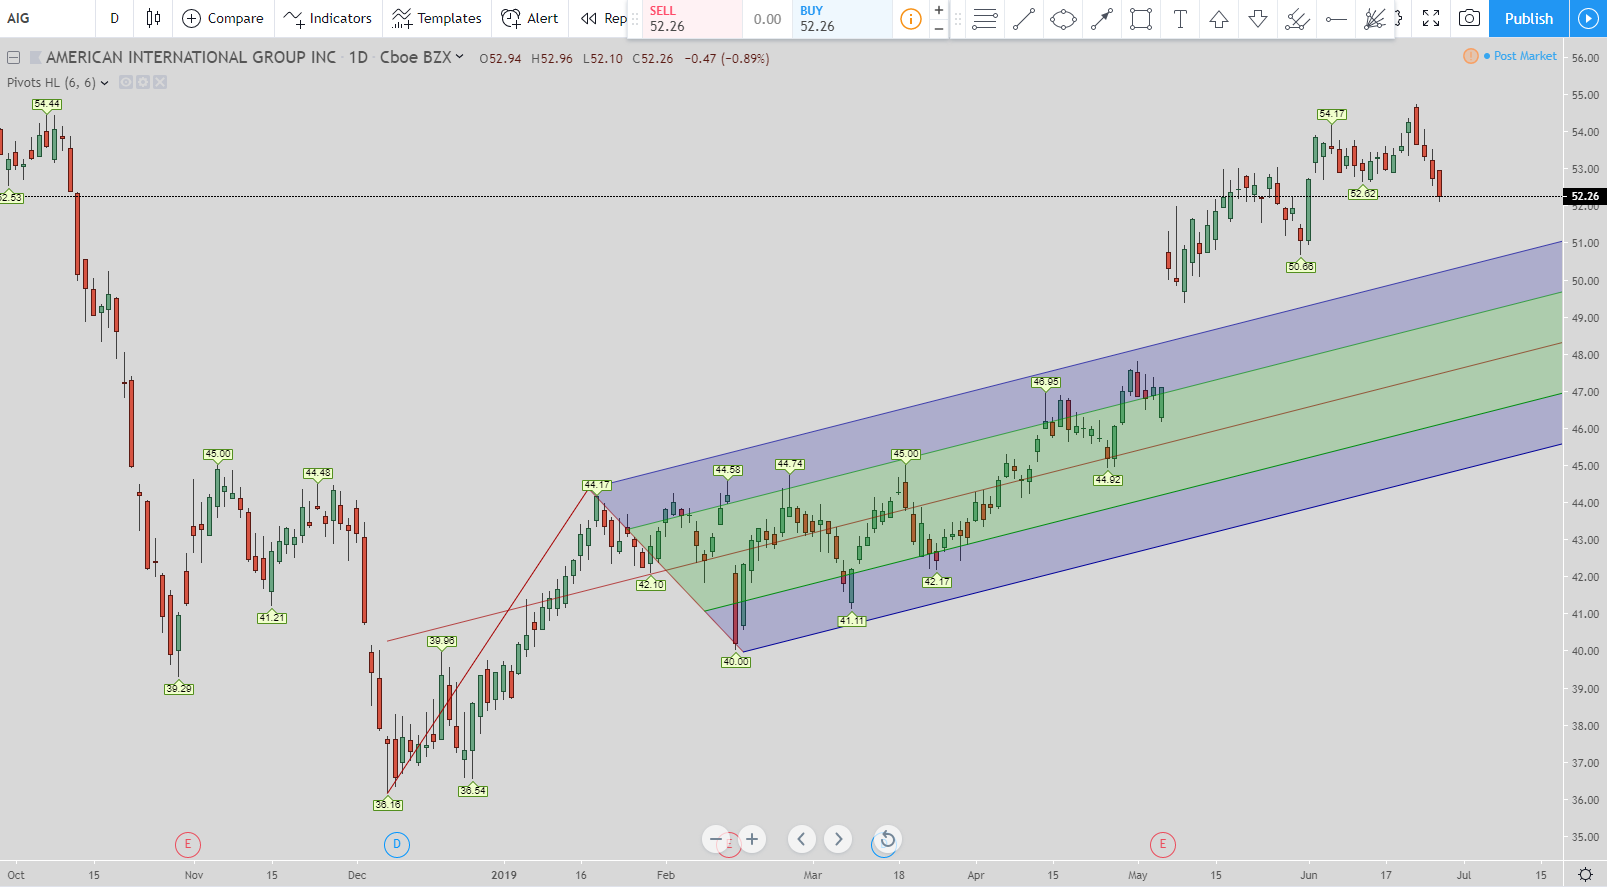
In the daily chart above you can see how AIG is in a very strong uptrend. In fact, it is so strong the price has broken out of the Schiff Pitchfork. This is using the daily time frame. Right now it is doing very well. The one thing to keep in mind from the chart is the big gap. 90% of the time the gaps in an uptrend come back and get filled. So that is one negative if you are long or looking to buy.
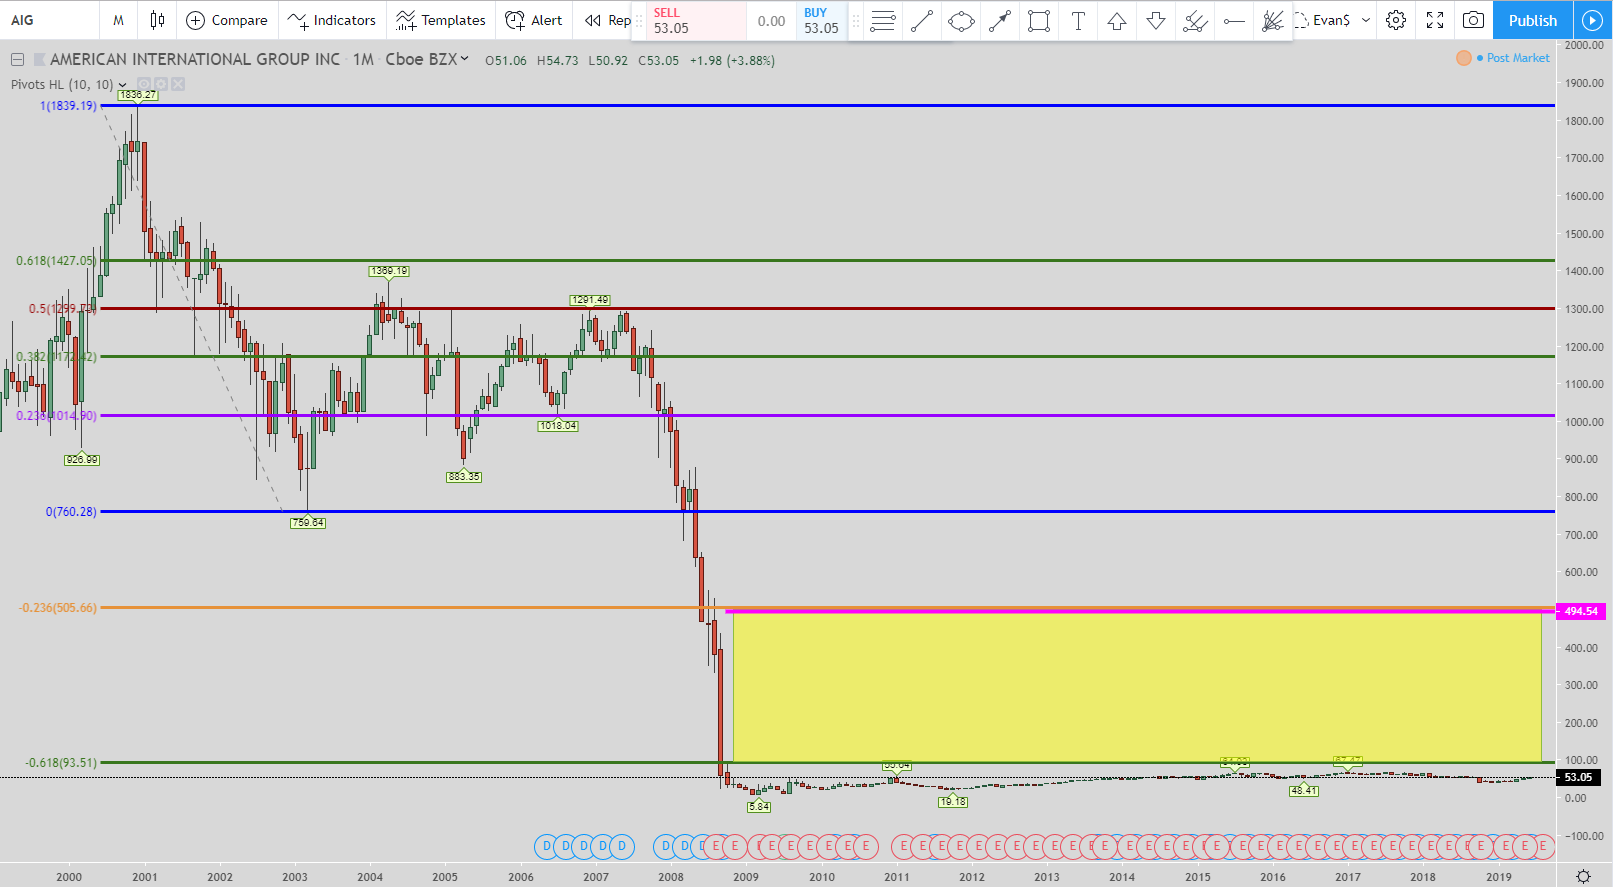
If you want something crazy then check out the monthly stock chart above. I’m not sure what happened back in the day but AIG had a huge drop off from its high at around $1,800.
The setup for this is the 123-161 long trade setup. Price blasted through the 123.6% (orange line) and also through the 161.8% Fibonacci extension level (the green line). When American International Group Stock did that then that moved the exit. The current exit is the pink line or the top of the yellow box at around $495.
So if you are a believer in AIG and see them picking it up over the next 5-10 years then now is a great time to start getting in the stock. As you can see with the current price of around $53 then the exit at $495 could provide huge returns.
The American International Group stock also provides a 2.41% dividend. So if you believe in the stock then getting in and expecting the stock to move all the way up to that level plus the 2.41% dividend could be a great play.
There aren’t any short plays that I saw and I went through the 15-minute, 1-hour, daily, weekly, and monthly time frames. There was a long setup that was just completed and I’ll show it below.
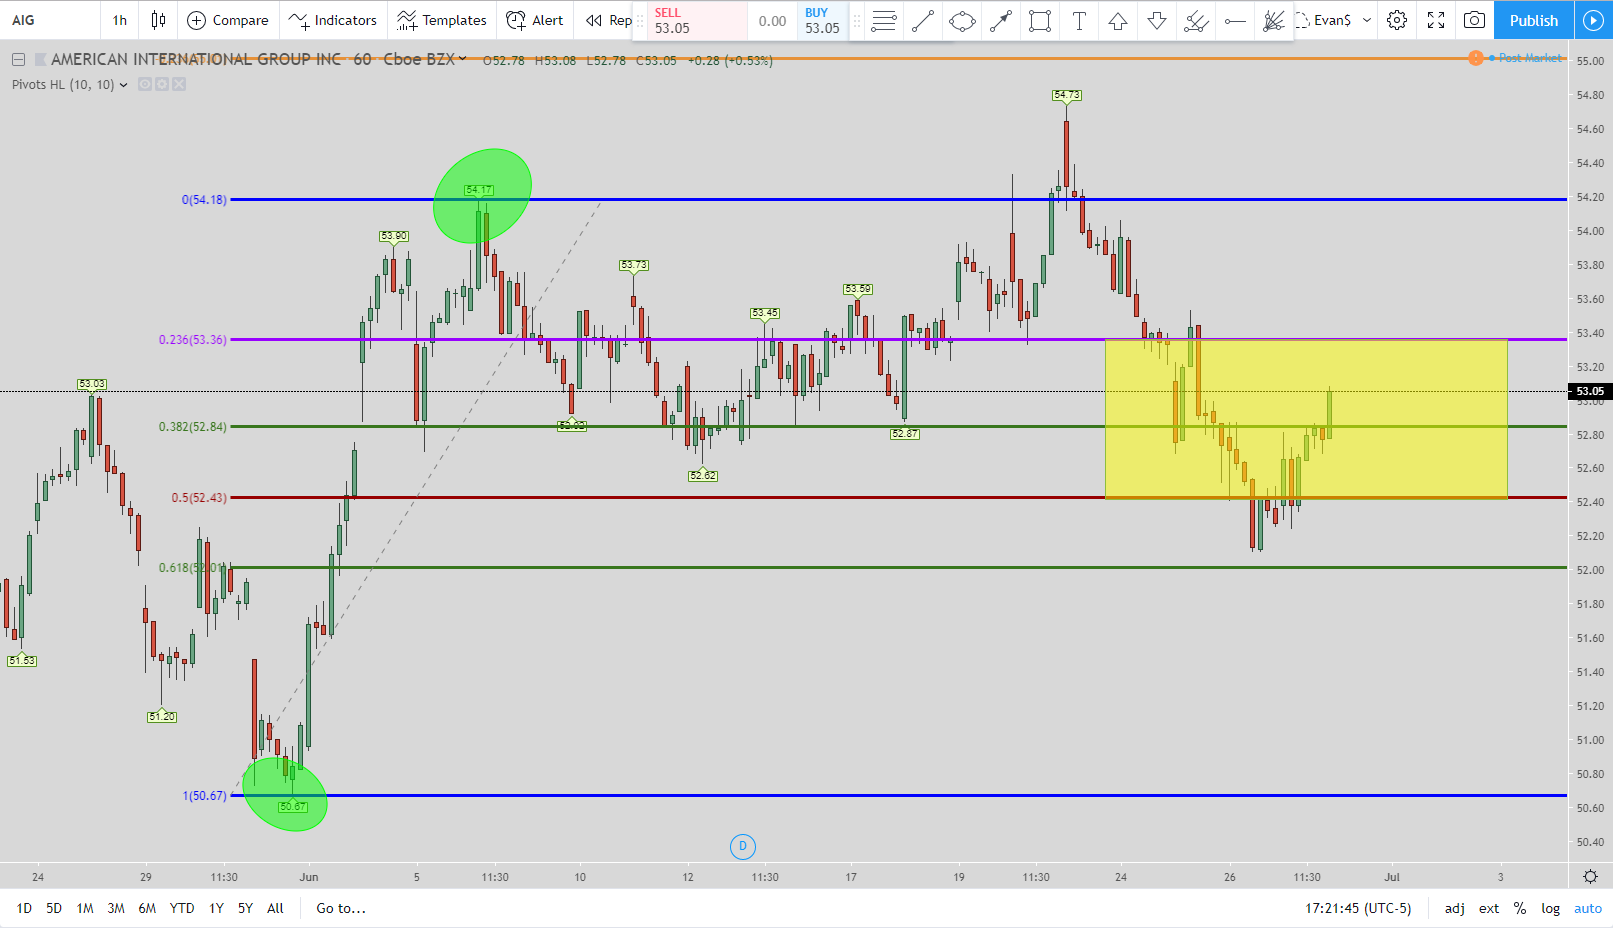
In the chart above the setup is the long Springboard setup. You can see how price missed the 123.6% Fibonacci extension area. Then the price came down and hit the 23.6% Fibonacci retracement area. This initiates the short position.
From there you can see how the stock moved down to the 50% retracement level which is the red line. That is the exit for this setup. So you can see how price fulfilled it really fast once the setup is initiated. I reviewed this stock a couple of days too late for this setup to be live.
Conclusion for American International Group Stock (AIG): Will It Protect You Like Their Insurance?
Overall the American International Group stock is not considered a growth stock based upon my growth parameters. Although that hasn’t slowed the stock down this year from going up so far. Based upon the technical setups there is a monthly long setup.
If you are a believer in the stock then this could be one to get in and reap big rewards. I don’t think I will get in and try it but I might. I have no plans in the next 48 hours to get into the stock but I am thinking about it.
If I am looking to park money and dollar cost average down if the stock does go down then this could be an amazing play in the next 5 – 10 years. That, of course, is a very long term play. So if you are looking at it with that mindset then this could be for you. Plus you have a 2% dividend yield so you’ll receive a little money while you wait and hold onto the stock.
Popular Links
Here are a couple of links if you are looking at how I view the market and my trade setups as well as the products I like and use.
- How to become a profitable trader using meditation
- How to scan for winning stocks
- Bread and Butter Trade
- How to Improve Your Meditation with the Brain Evolution System
- Review: Stikky Stock Charts – An Excellent Trading Book That is Interactive
Robinhood Trading Broker Review
If this post benefits you and if you haven’t used Robinhood for trading stocks but are thinking to then please consider using my referral link when you do sign up: http://share.robinhood.com/evanc203.
This way each of us will receive a free share of a random stock if you sign up through my referral link.
My Robinhood Review: https://evancarthey.com/review-robinhood-trading-service-with-no-fees-part-1/


