For the past week or two the Dow Jones (DJIA) has been looking like a yo-yo. So what is going on with it? From a previous post I analyzed the S&P 500 Index: https://evancarthey.com/is-the-market-headed-for-a-40-correction/.
The analysis here will be the same way I look at the markets. Despite all of the doom and gloom recently you will see that we are still in good shape for the time being.
SELL EVERYTHING NOW!
Just kidding, check out this chart:
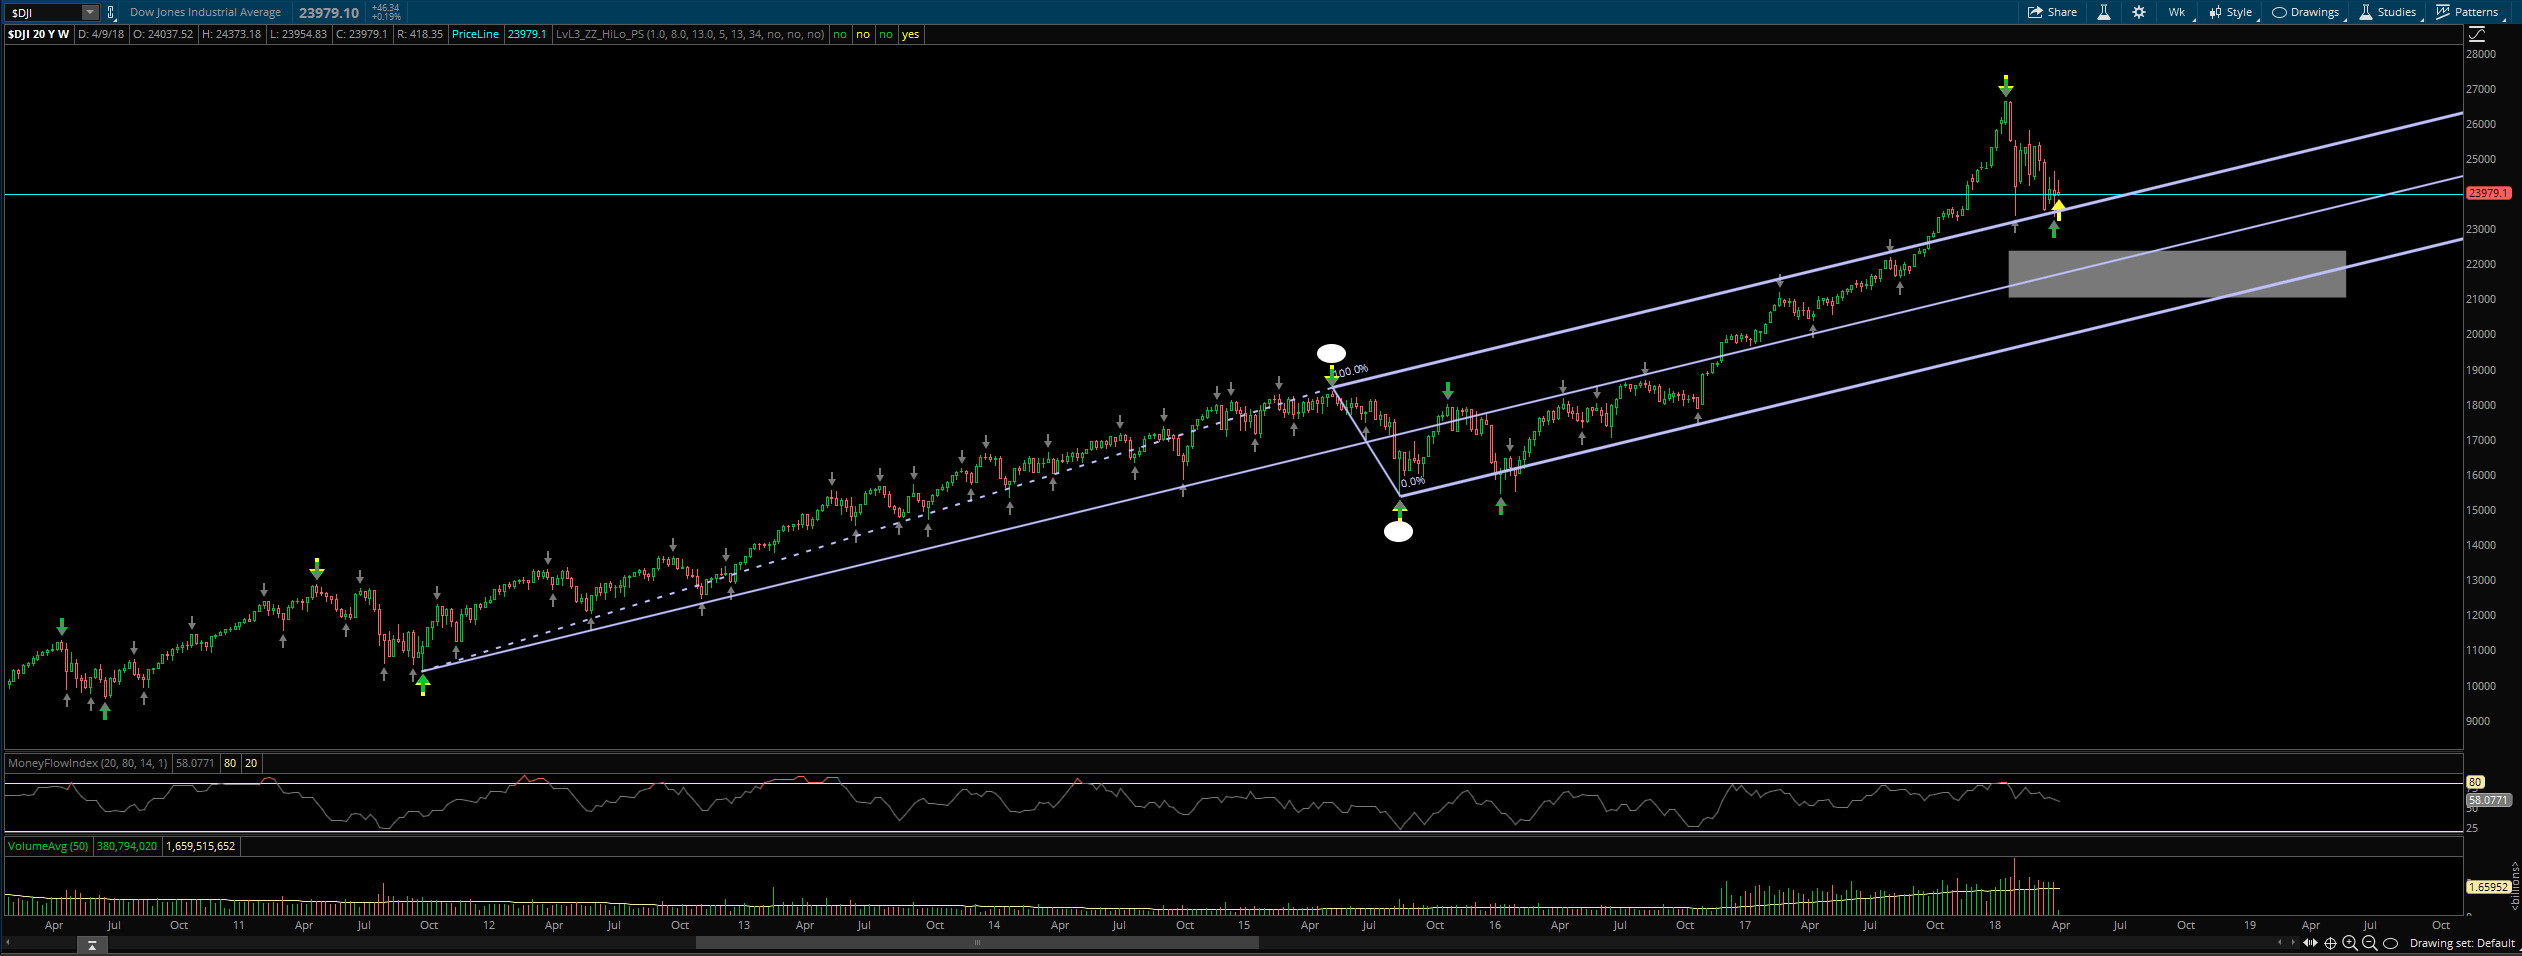
I recently started drawing Andrew’s Pitchfork from the weekly charts due to the daily providing too many whipsaws. Now the AP drawing seems to be more accurate long term but I still have my entries and exits based off of the daily chart when I trade. Basically I go a time frame higher to draw Andrew’s Pitchfork.
You can see in the weekly chart how price is just bouncing off of the upper AP line. The Dow Jones is still very strong despite what CNBC moans about anytime there is a red day.
Daily Chart Fibonacci Extensions
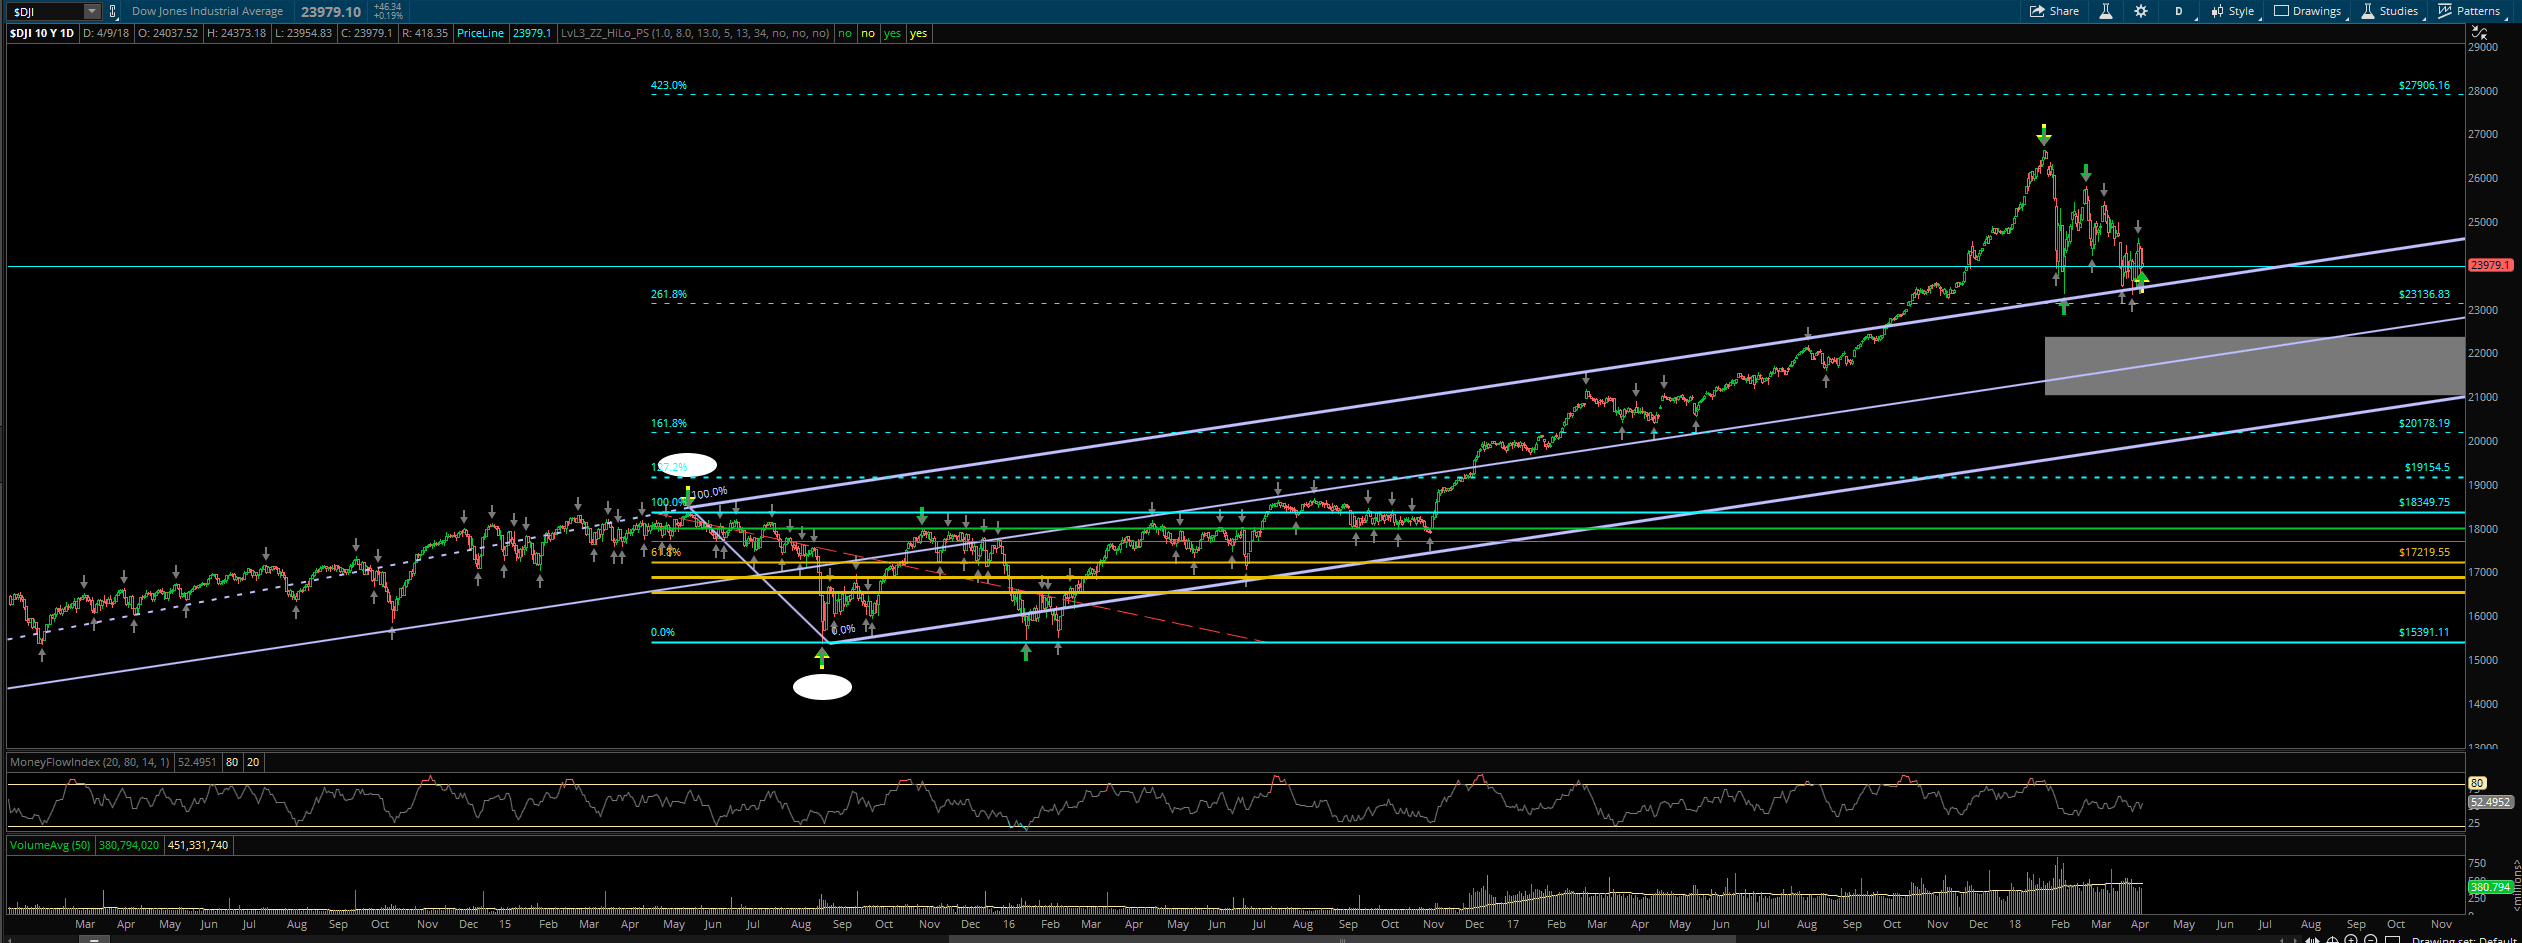
In the daily chart you can see that price almost made it up to the 423% Fibonacci extension before it started retracing.
Daily Chart Fibonacci Retracement
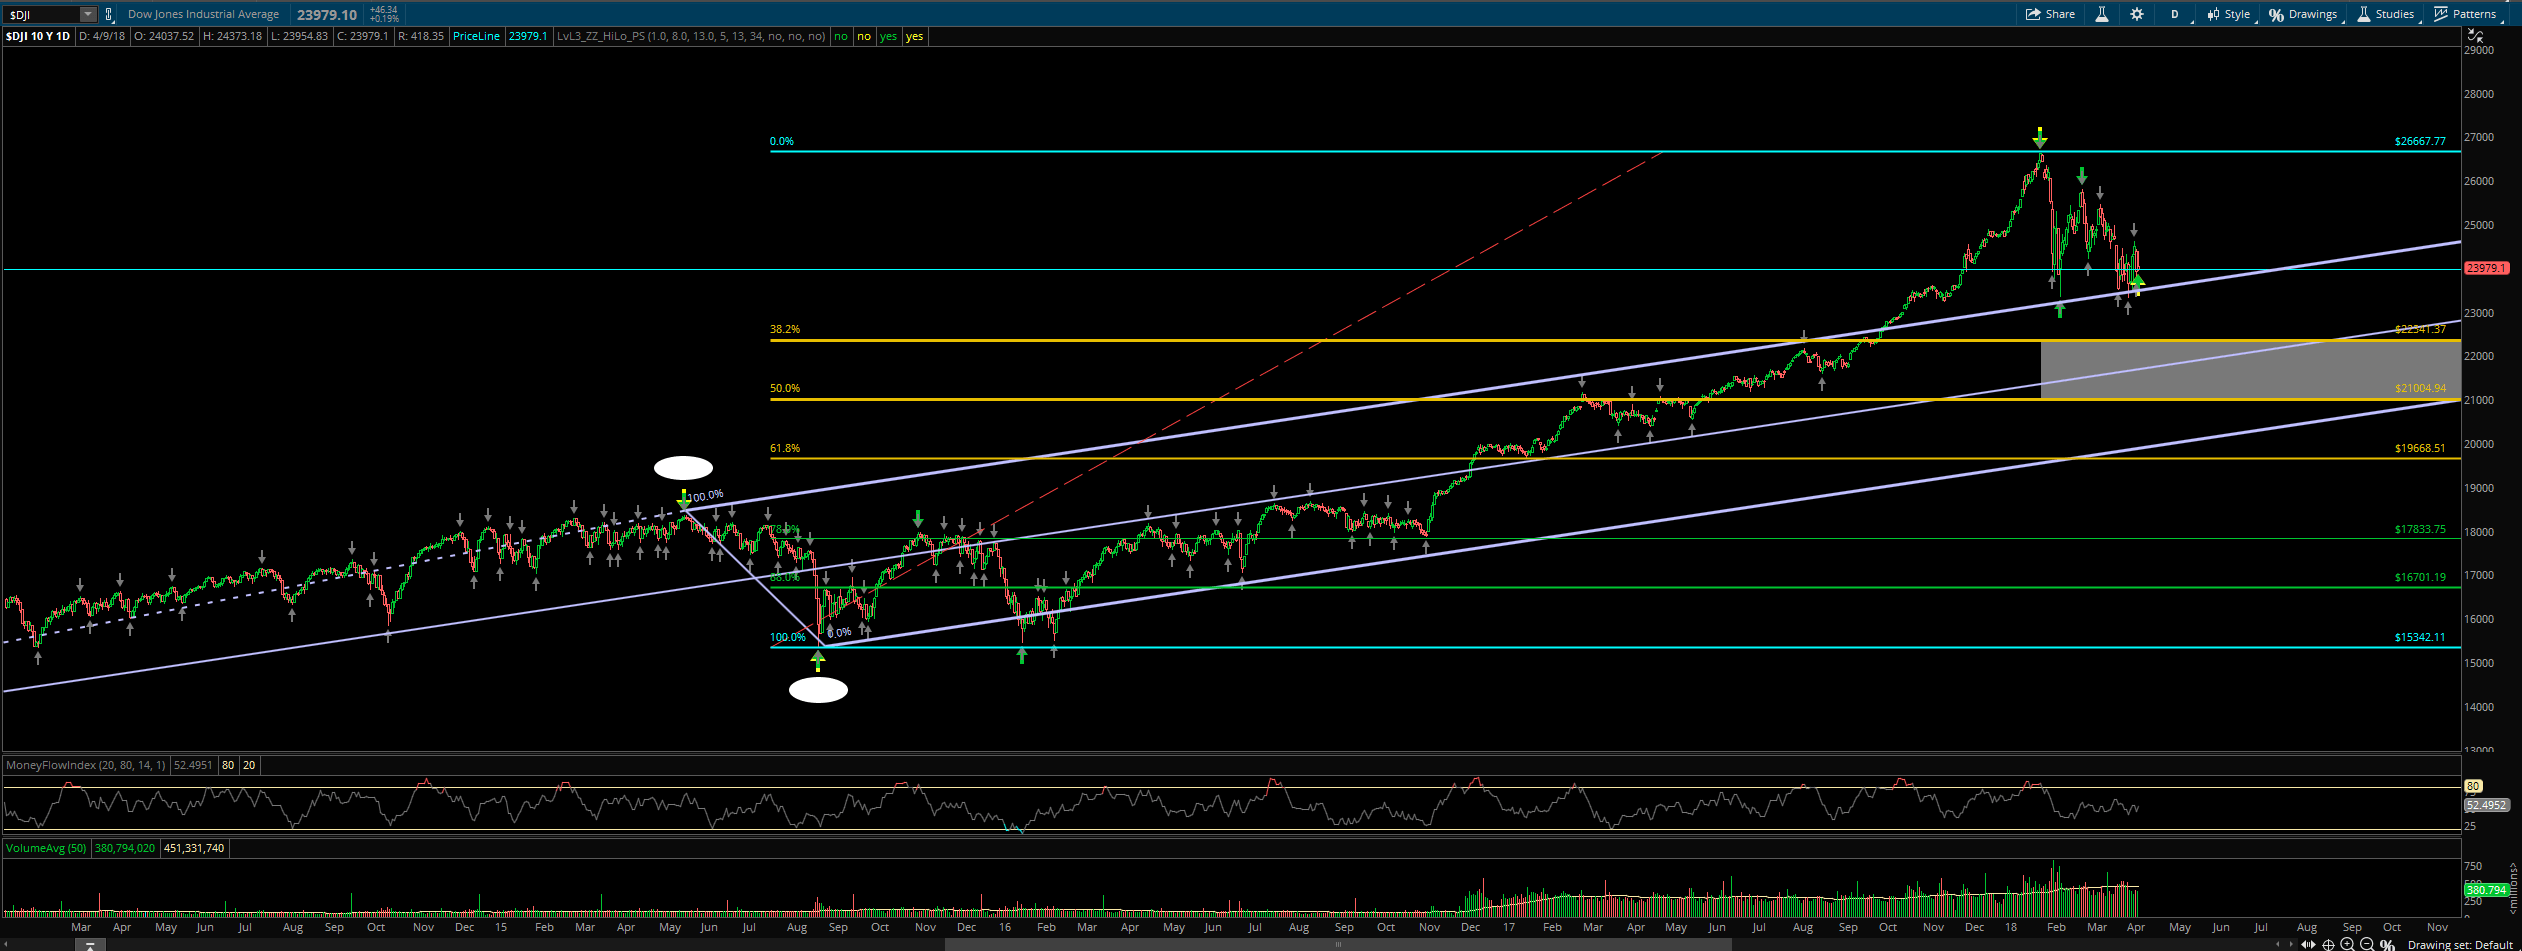
Currently price has not completed the retracement minimum for the retracement to be over for the daily chart. I consider a retracement downward to be over at the 38% Fibonacci level (50% for a retracement upward). The top of the gray box is the 38% level.
38% Fibonacci Retracement Level
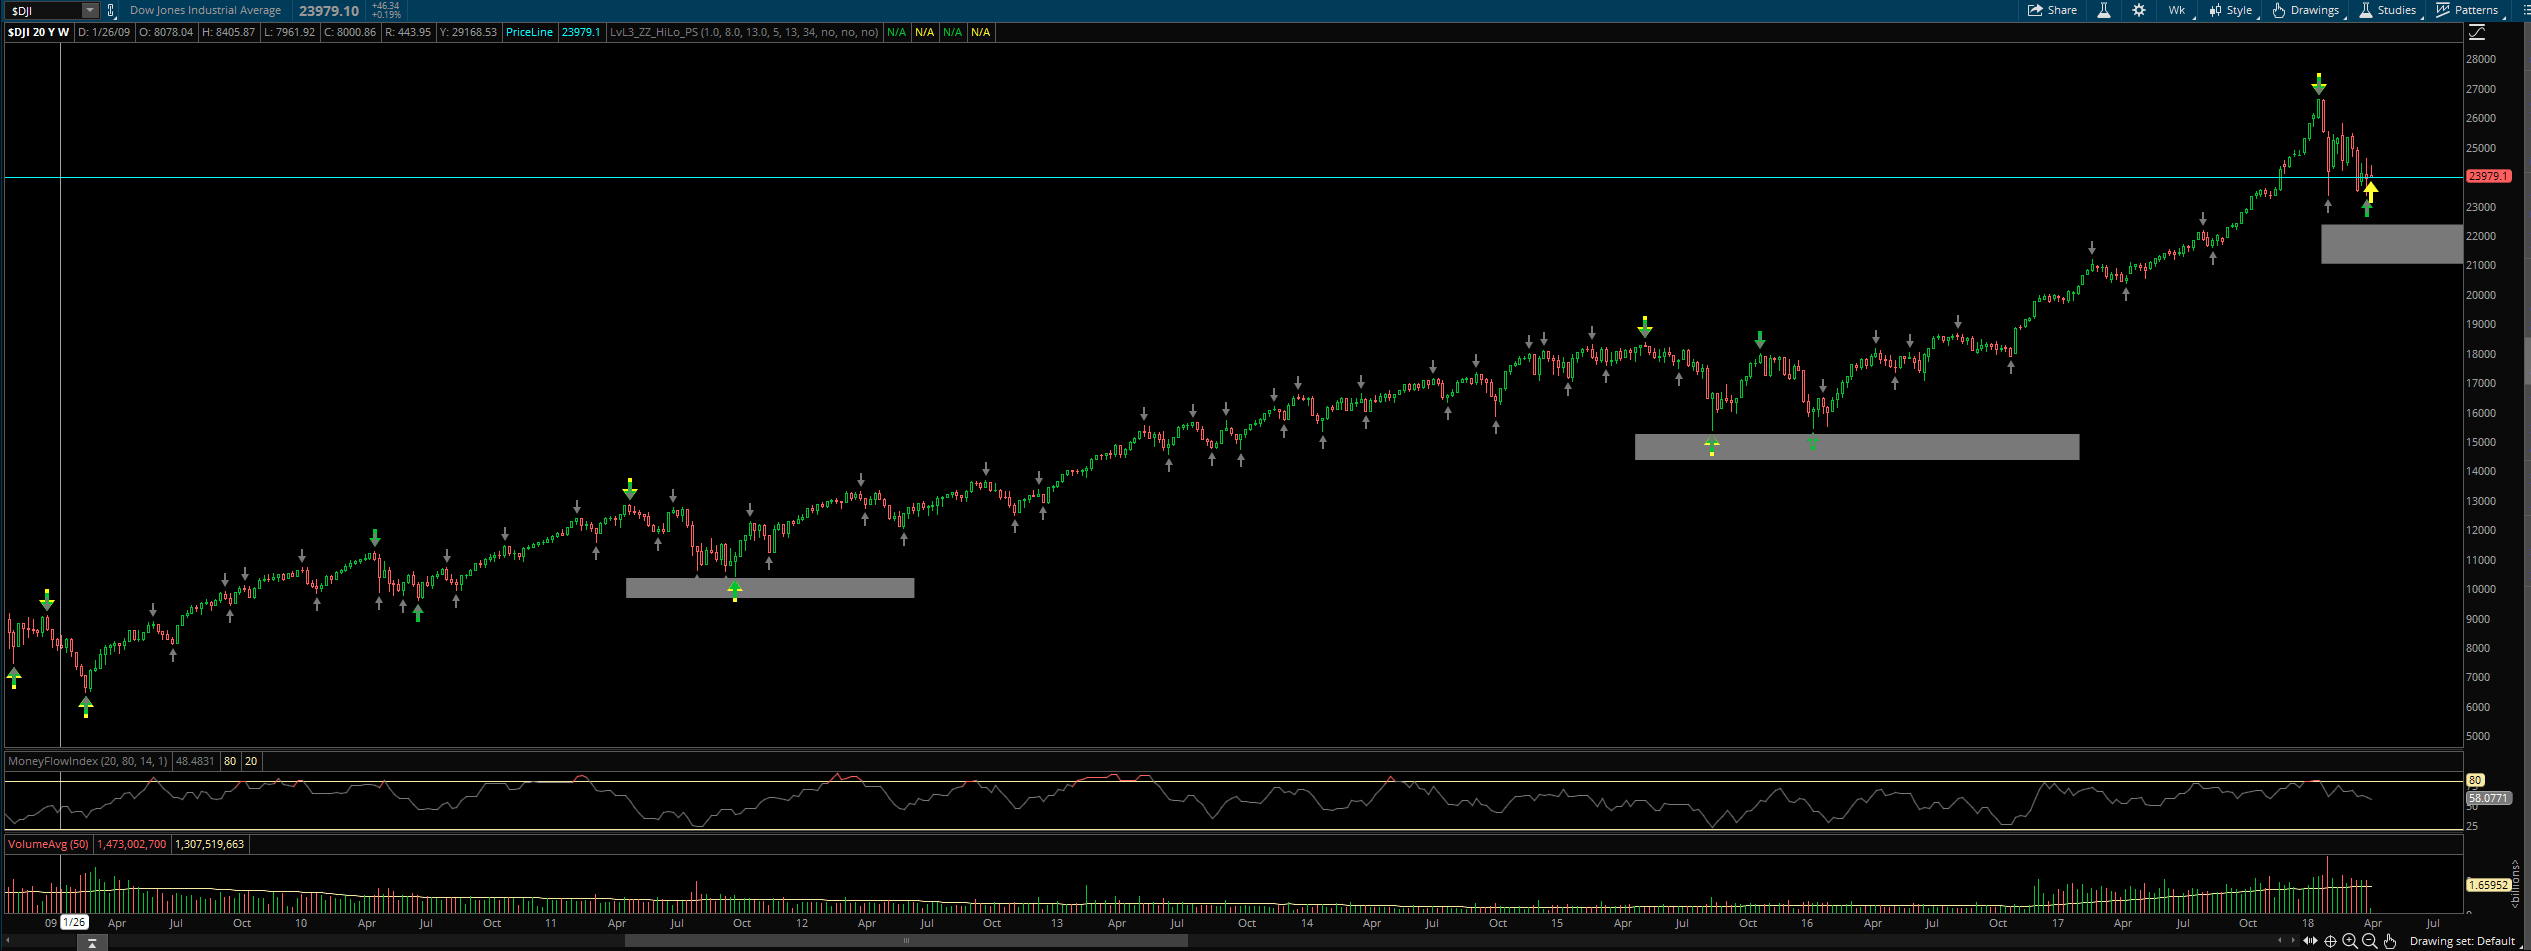
Look at this, the top of the gray boxes are the 38% Fibonacci retracement levels. Look how it has been major support the past two retracements. That doesn’t mean this time it will be but for the past 2 times it has been. So when price hits it we can probably expect some support, at least temporarily.
The Monthly Chart Tells the Real Story
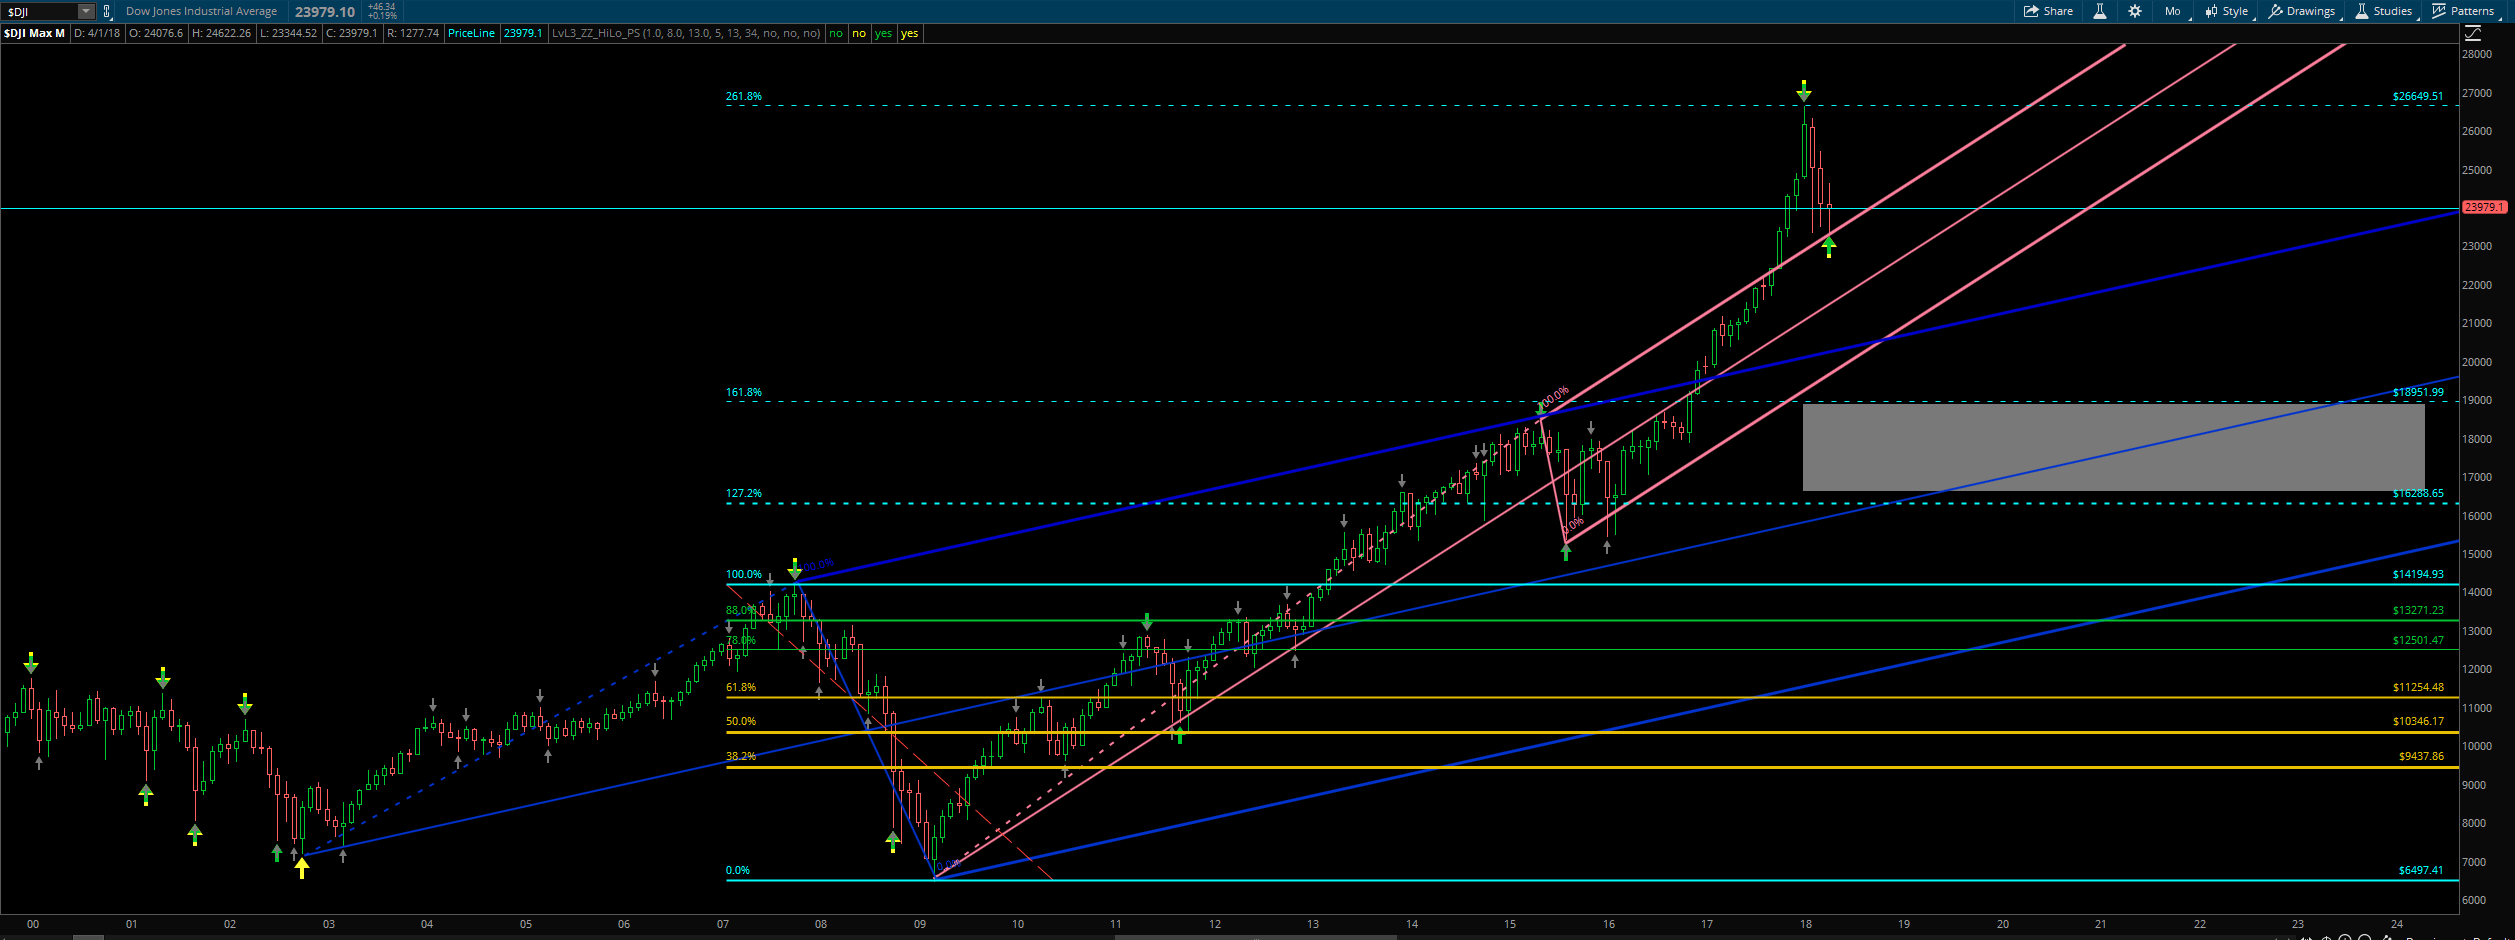
Here you have it. The monthly chart tells the real story. Look at how perfectly price hit off of the 261.8% Fib extensions level. Price is still above the top of the AP level (blue lines). From the intermediate AP (red lines) it has just hit the top.
The top of the gray box at 18,901 is the 38% Fib retracement trade. When the retracement is underway this is the minimum the move will go. You’ll here CNBC and the rest of the “experts” talking about gloom and doom but this is what has to happen for the retracement to be completed.
There are still a lot of levels for the Dow Jones (DJIA) to go through so this retracement is not making its big move downward soon.
What is my no-hedge prediction?
After the huge run up from around 15,500 I think price churns here for awhile. Eventually price will hit the 38% Fib retracement level and there will be support on the daily chart at 22.294. It will have to work its way through the retracement levels plus the Andrew Pitchfork lines so we’ll see a lot of bounces as the move down happens. For the time being the big crash isn’t happening soon.
We’ll see some more big daily moves as the big boys start setting themselves up for the move down. From the daily chart the move down doesn’t look bad at all. We have the 50% Fib retracement level and the lower AP line for support. Price will eventually retrace as it always does but it won’t be tomorrow or the next day.
We’ll eventually hit the monthly retracement level at 18,951. For the time being if you trade support and resistance levels then now is the time. The big upward trend is over.
LOOK FOR PRICE TO MAKE ONE MORE MOVE UP TO BREACH THE PREVIOUS RECORD IN ORDER TO TRAP PEOPLE AT THE TOP! THEN THE MOVE DOWN WILL HAPPEN.
It could be a double top but those are too obvious. Look for a breach above the previous record high and then be careful if you are long.
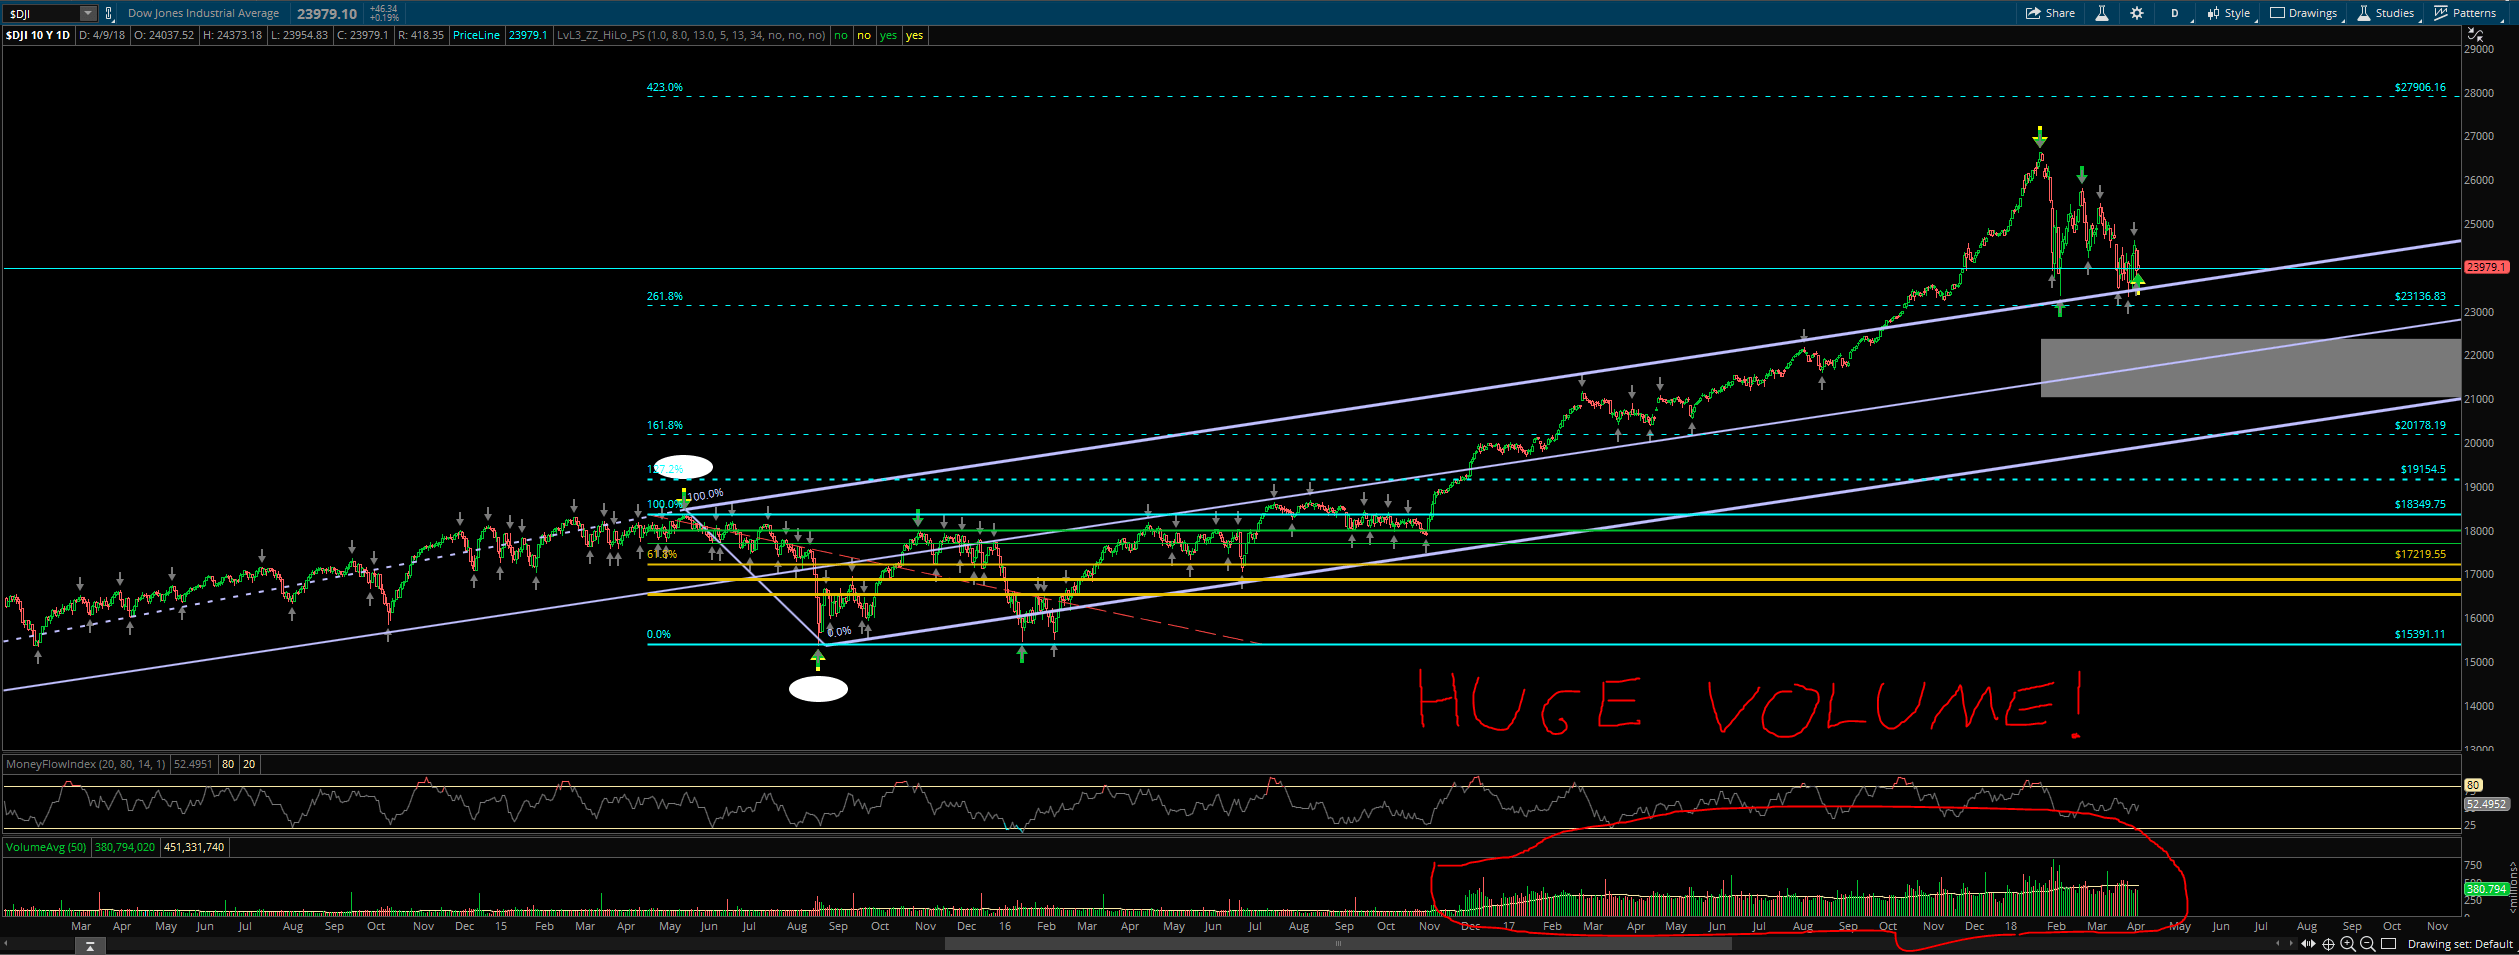
Huge Volume in the Dow Jones (DJIA)
One last thing I would like to point out is look at the huge volume since December 2017! Compared tot he previous 3 years I have on the chart it blows it away. There has been some serioius money put into this move higher. It has still on average increased higher since January 2018.
