The 200 and 500 Day moving averages are extremely popular. I always see them on people’s charts. Whether or not people make money using them I am not sure. This ultimate guide to the 200 and 50 day moving average strategy is one I do not personally do not use but it is very popular with a lot of people. I have tested it but could not find a way for it to work consistently for me. This strategy is how I would trade the 200 and 50 day moving averages. I sometimes have them on my charts because I do use them as a reference.
The 200 and 50 Day Moving Averages – Entry
What you have to do is choose the type of MA’s you want to use. I prefer to use the exponential moving average. This strategy is pretty simple from the way I have tried to use it in the past. What you do is when the 50-day MA crosses over the 200-day moving average then that is your signal to look for a long.
But you don’t enter the trade just then. That is what most people do, they enter the trade when the MA’s cross. You wait for a pullback. What you do is you wait for price to retrace back to either the 50-day moving average or the 200-day moving average. When price hits one of those moving averages depending on which one you want to use then you get in the trade.
A retrace to the 50ma is an aggressive entry. The normal entry is a retracement back to the 200ma.
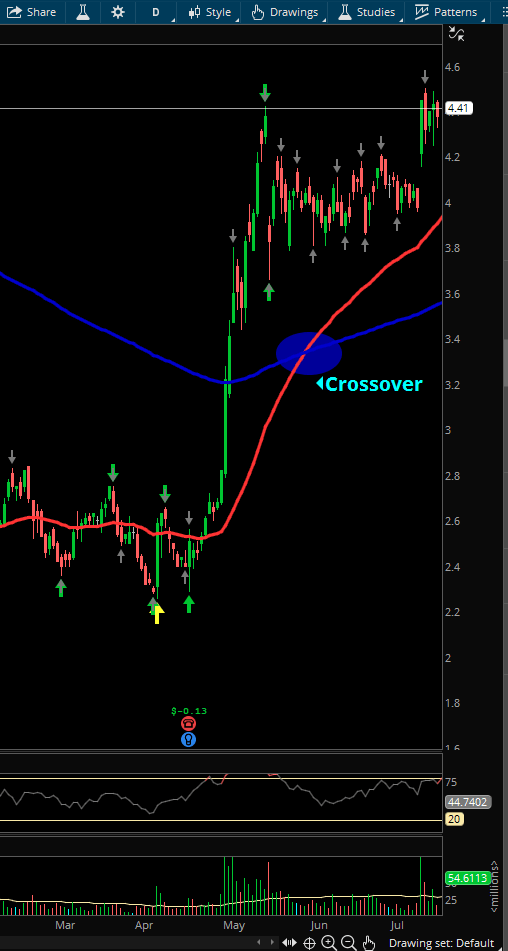
Crossover entry 2As you can see from the two pictures above the first one is when you would go long. The blue line is the 200-day moving average and the red line is the 50-day moving average. So when the 50-day moving average crosses over the 200-day moving average then that is your signal that you should consider going long. I highlighted when the moving averages crossed over and where you would enter.
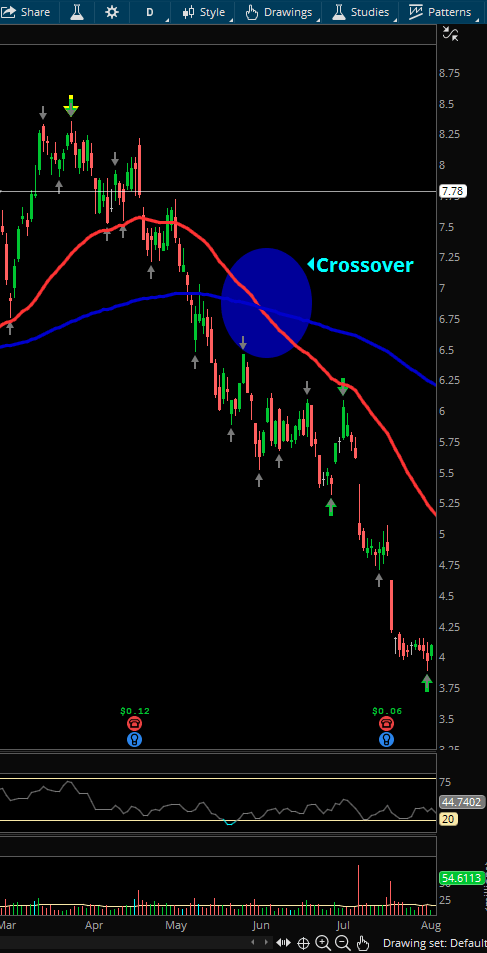
In the second picture it is an example of a short set up. The 50-day moving average has cross below the 200-day moving average.

Crossover 2
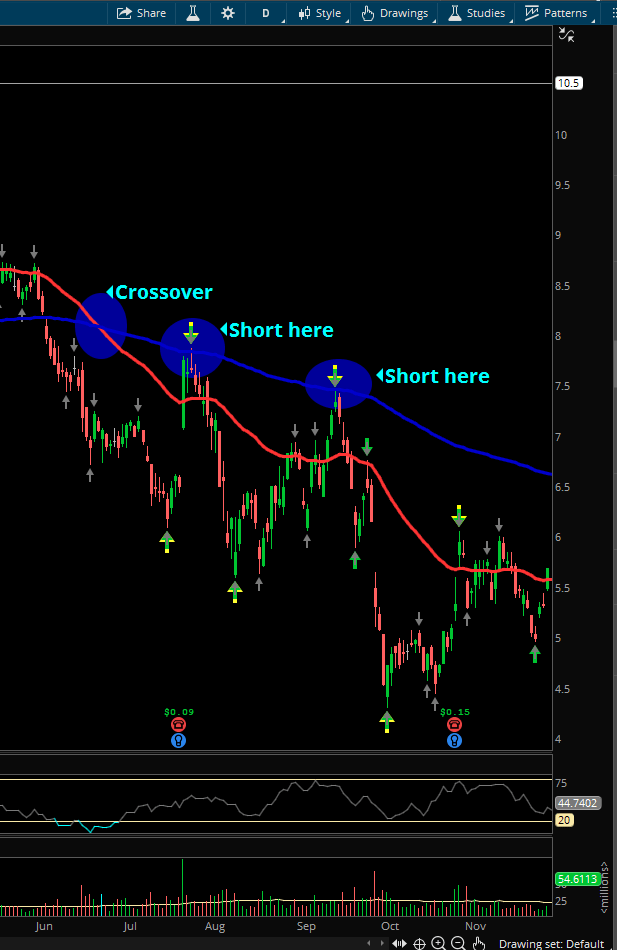
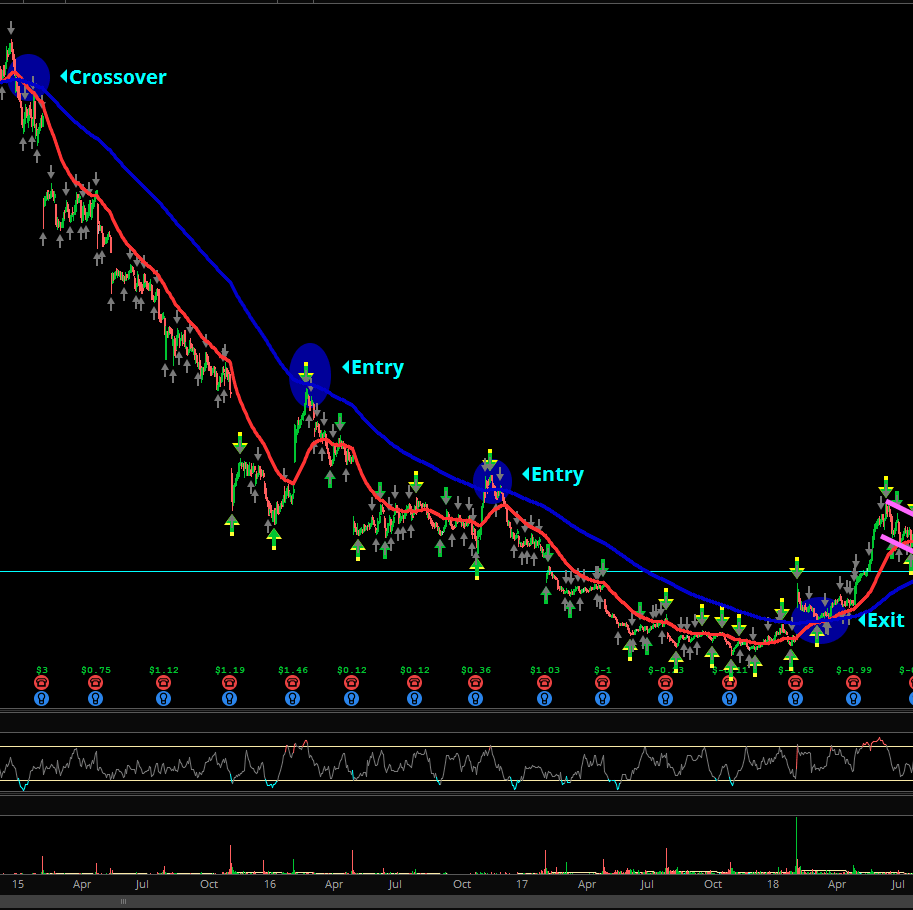
From the two examples above this is when you would consider getting in on the trades. As you can see price crossed over from the fifty through the 200 in both of the examples.
The top example is when you would go long. The bottom is when you would go short. As you can see for the long example price retraced back to the 200-day MA when price touched the 200-day MA then you would get in the trade. for the short example when priced retraces back to the 200-day MA then you would go short.
Exits
With your exit you can either wait for the 50-day MA to cross back through the 200 day in order to get you out of the trade. Or you can use whatever other signals you use for your own exits.
One benefit of waiting for the moving averages to cross over again is you will maximize how far to trade can go. The main negative against it is that you can give up a lot of your games as you wait for the 50-day MA to cross through the 200-day MA.

Conclusion
You will see a ton of people out there trying to sell systems based upon moving averages. From what I have found I have not seen a moving average system that consistently works. Moving averages in my opinion are best used to wear price could see reversal or support or resistance.
They should be used as opinions rather than facts in your trading. Usually the people saying that they do work are the people who are trying to sell you a system for it. Like I said I have never heard or seen anyone who uses a moving average trading system as the basis for their trades. In my view of moving averages I would use them as influence’s to what and how I am looking to trade.
Yes they can work, yes they can give you big results, but in my trading I have not found a way to consistently use them for consistent profits. The entry was the easy part, it was the stop loss and exit that I couldn’t find what worked for me.
There are numerous times when this strategy does not work so use caution if you attempt this. Just put the 200 and 50 day ma on your charts and see for yourself. Sometimes price respects the retrace and other times it acts like it isn’t there.
This is definitely a trend trading strategy. If you catch a big trend then this setup will work. If your trading vehicle isn’t in a big move then your gains will be minimal or more than likely negative.
I know a lot of people like to use them and that’s fine. You have to figure out what works best for you but what I presented above is the way I have tried to use them in the past. They are a tool just like every other indicator out there. Everyone has their own style of trading and you have to pick and choose what works best for you.
There is no holy grail of an indicator or indicators.
P.S. – If this post benefits you and if you haven’t used Robinhood for trading stocks but are thinking to then please consider using my referral link when you do sign up: http://share.robinhood.com/evanc203.
This way each of us will receive a free share of a random stock if you sign up through my referral link.
My Robinhood Review: https://evancarthey.com/review-robinhood-trading-service-with-no-fees-part-1/
