The market has been in a little bit of a roller-coaster to end September and in the beginning of October. The stock market today has been looking like it really wants to break to the upside now in October but just can’t seem to do so. This is as of 10/7/2019.
This post will go over the S&P 500, the Nasdaq, the Dow Jones Industrial Average, and the Russell 2000. It will cover the month of October which has shown to be a historically volatile month. With the political news of the Democrats stopping at nothing to try and impeach President Trump, it should make for another wild month in all of the markets.
Although, September is when the major crashes have started, October is the month that gets the blame for it. Here is an article which goes over what I am talking about: https://www.investopedia.com/articles/financial-theory/09/october-effect.asp
October gets a bad rap in finance, primarily because so many black days fall in this month. This is a psychological effect rather than anything to blame on October. The majority of investors have lived through more bad Septembers than Octobers, but the real point is that financial events don’t cluster at any given point.
The worst events of the 2008-2009 financial meltdown happened in the spring with Lehman’s collapse. More stocks fall in November and December due to year-end rebalancing and many financially damaging events haven’t been given Black Day status simply because the media didn’t choose to dust off that moniker at the time.
Although it’d be nice to have financial panics and crashes restrict themselves to one particular month, October is no more prone to bad times than the other 11 months of the year.
If you read the article I linked above and this article you can see how September should really be the month everybody hates in the stock market, especially over the month of October.
Sometimes that is the way life goes. You get treated unfairly even though it isn’t your fault. Sorry October.
October has secured a place in history as the fourth worst month for the Dow Jones industrial average and the S&P 500 Index, two of the stock market’s major averages. The “Stock Traders Almanac” has labeled October a jinx because of the frequency of market crashes that have occurred in the month, according to a 2012 “USA Today” article. The worst October ever was in 1987, when the stock market declined more than 23 percent.
The Stock Market Today (S&P 500)
For all of the markets I am going over, I will be using the 1 hour and the daily chart. The 1 hour fits into a monthly time-frame very nicely. The daily gives a broader view of the market so we can identify any major trends or setups to be aware of in the markets.
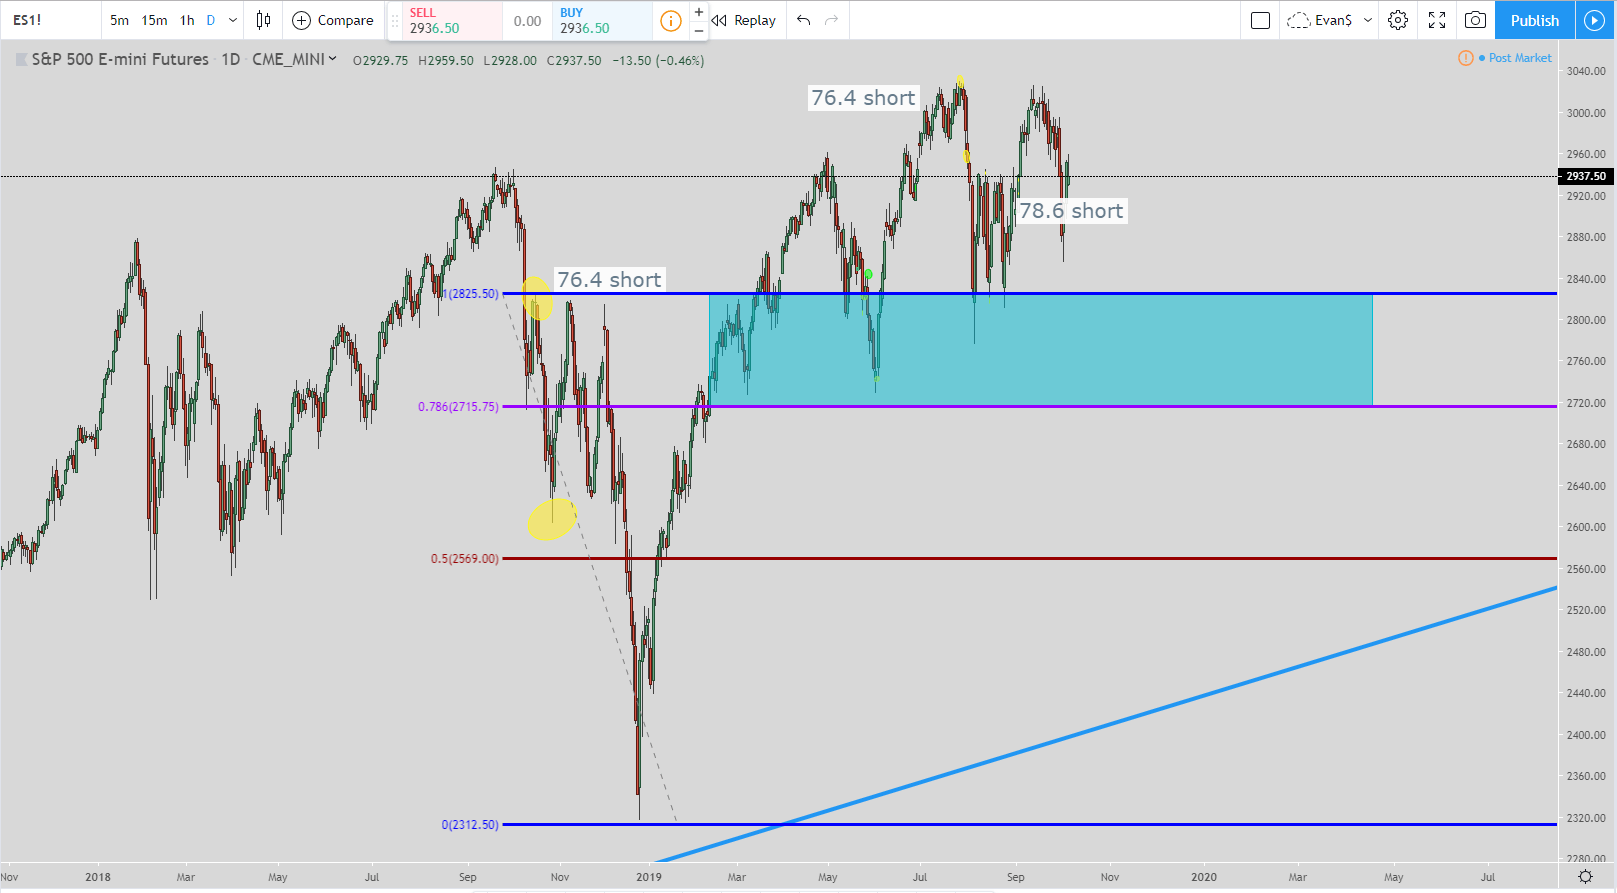
Here is a daily chart for the stock market today of the S&P 500. This setup I am using is showing are in a 78.6% short trade. The current exit is the bottom of the blue box around 2715.75. This is a setup we have been in since early 2019. The next entry is way up at 3655.75 so if we look like we are getting close to that territory then I will alert you well before then.
I fully expect the exit of 2715.75 to be hit before the entry of 3655.75 is hit. Obviously that isn’t going out on a limb with that prediction but I wanted to explain why I wasn’t bothering to show the next entry-level.
Since this is on the daily time-frame it can take months, if not years for it to complete. We are already in month number 10 of this setup and it doesn’t look like it will be getting completed any time soon.
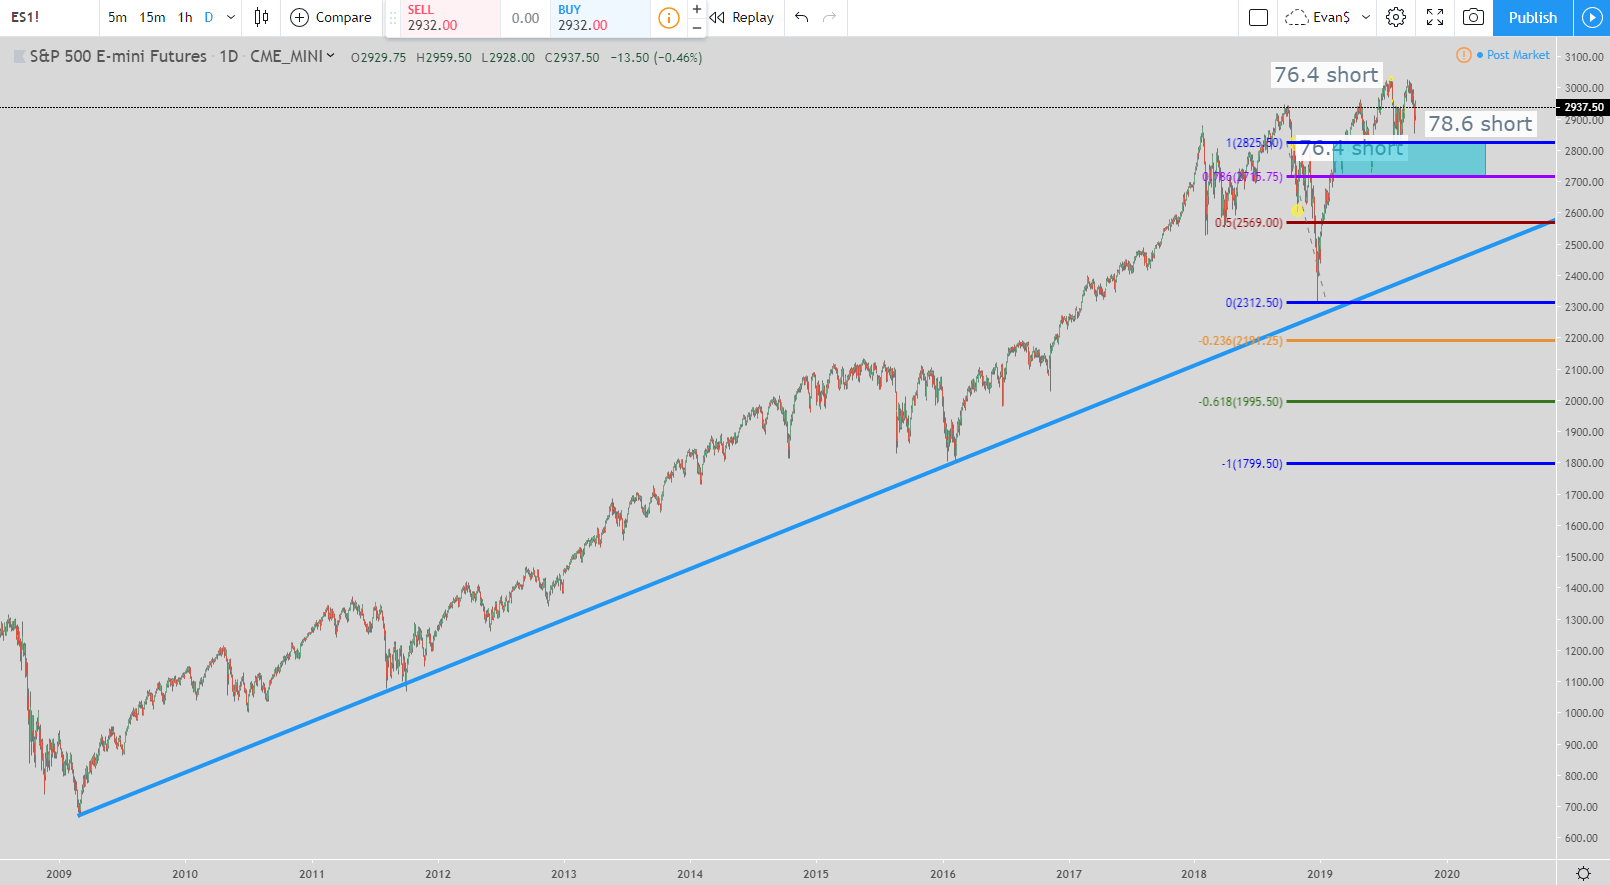
In the second chart this is a very long term daily chart that I zoomed out of to get a better look at the overall trend. Clearly the S&P 500 is in an uptrend.
For me, I am not worried about a crash or correction happening until that blue trend-line is broken. Even when it does break I will look for a move back up for the blue line to turn into resistance and then the move down.
So until we think we are going to break the blue line I would be looking at any pullback as an opportunity to get into the market. In fact, I did exactly that last week that I exited out of today. You can see it in the post where I did a video about a trade setup. In it I showed the exact trade I am talking about: https://evancarthey.com/day-trading-setups-for-maximum-profits-the-78-6-trade/
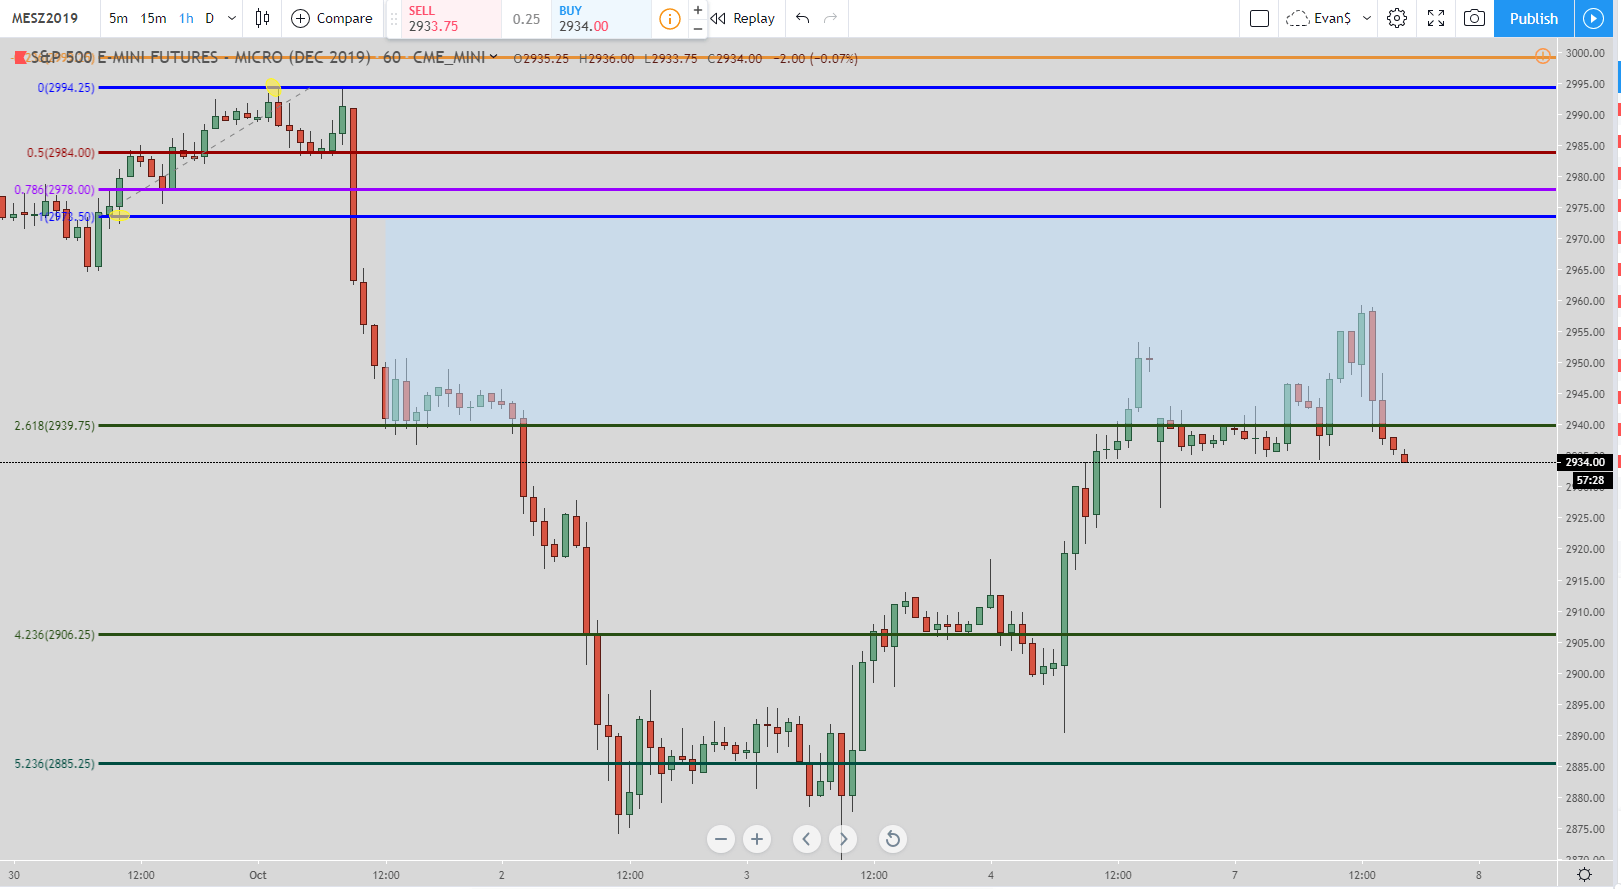
In the one hour chart for the S&P 500, we are in a long setup using the 78.6% trade. This is a trade I was long in but got out of today. The reason why is because I had a decent gain and wanted to lock it in. If the price does retrace back down to around the 4.236% Fibonacci extension level then I will be looking at getting back in.
This is a setup I am looking for the market to complete before it makes its move down to complete the daily time-frame setup I mentioned just a bit ago. Now I am not saying the daily short 78.6% setup will be completed after this long setup is completed. What I mean is I expect this 1-hour long set up to be completed AND THEN the daily 78.6% short setup could go down and get completed.
That isn’t guaranteed to happen but short term I am bullish in the S&P 500 so that this setup is completed.
I will be looking at getting back in this long setup if the price keeps going down to somewhere around 2910. The exit I will use will be around 2970. The hard exit is the 100% Fibonacci line at 2973.50 but I always get out sooner than the hard exit to ensure my exit gets filled.
I have seen the price go up and barely touch the hard exit to complete the trade but there would not have been enough contracts traded to get me out of the trade.
Nasdaq Futures Live Technical Analysis for October

In the daily time-frame for the Nasdaq futures, you can see how we are in the middle of no-mans-land. We are between two trend lines and right now it could go up or down.
Since we have just bounced off of the lower trend line then the money would be on the upper trend line going up and getting hit. But you never know.
There aren’t any daily setups that I found so for the daily chart we are in a wait and see mode until the price breaks one way in an impulse move.

In the 1-hour chart for the Nasdaq futures for October, we are getting very close to a 78.6% short trade. When the price goes up and hits the purple line at 7823.50 then that will initiate the trade. The exit will be the bottom of the yellow box around 7696.50.
But if the exit is not hit and the price continues to rise to the 100% level at 7918.75 then the exit moves to the bottom of the blue box around 7823.50.
Finally, if the Nasdaq futures take off without either of those exits being hit and goes all the way up to 8638 (not pictured) then the exit will move to the bottom of the green box around 7918.75.
So when the price goes up and hits 7823.50 is when the short setup will start. Once one of the exits is hit then the move is over. Do not look to get in at an entry-level if it has not already been hit. The setup is over and it is now time to look for a new one which there will be plenty of.
Dow Futures Live Technical Analysis for October
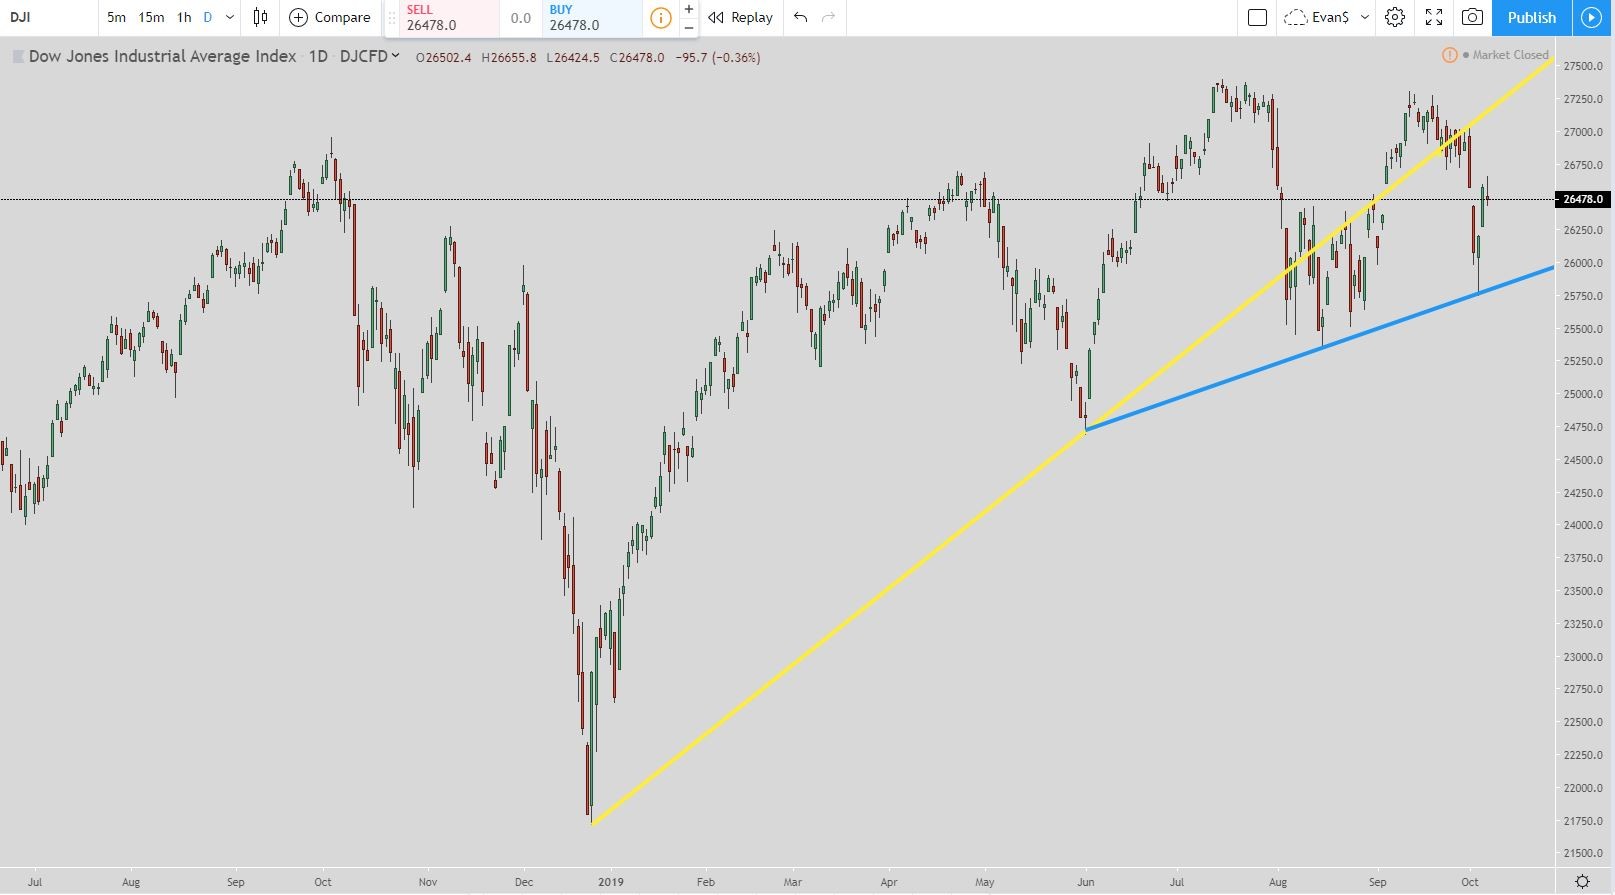
In the daily time-frame chart for the Dow Jones Industrial Average, we have two interesting trends happening. The first is with the yellow line. You see how price broke out of the trend then went above it for a little bit before coming back to it and then breaking down. This can signal the beginning of a trend break to the downside. You also have a double top form as well.
Then you have the flatter blue line where price has bounced off of it nicely. So as long as this line holds then the uptrend is still intact. But if this line breaks without another uptrend in the daily time frame taking place then I would definitely be on the lookout for a decent-sized move down.
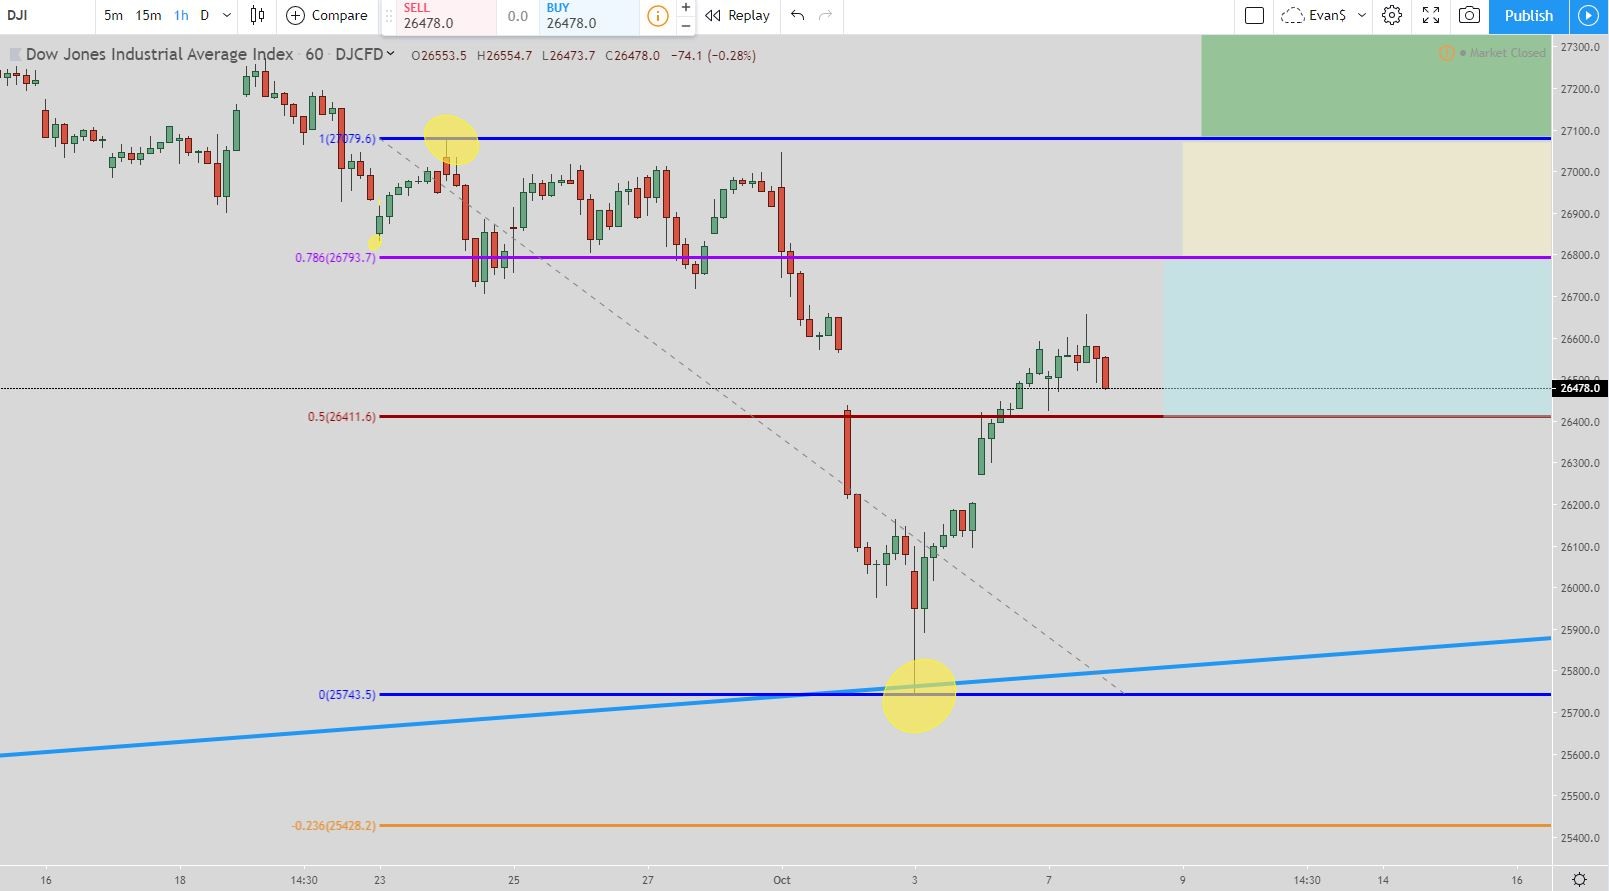
In the one-hour chart, we are waiting on the 78.6% short to develop. You can see to the left how the price just filled a gap and is taking a little break before moving up again.
When the price of the Dow Jones hits the purple line around 26,793 then that will initiate the short. The exit will be the bottom of the blue box around 26415. But if the price continues to go up and hit the blue line which is the 100% Fibonacci level then the exit moves to the bottom of the yellow box at around 26,795.
Finally, if the price sky-rockets up and hits the 261.8% Fibonacci extension level (not shown here but is in the video below) at around 29,240 then the exit moves to the 100% Fibonacci extension level at the bottom of the green box around 27,080.
So if you take every entry you would need 3 different entries if the price keeps going up and hits all of those levels.
But once an exit is hit then the setup is over. You do not get in with any unfulfilled entries. The setup is over and time to look for another one.
Russell 2000 Technical Analysis
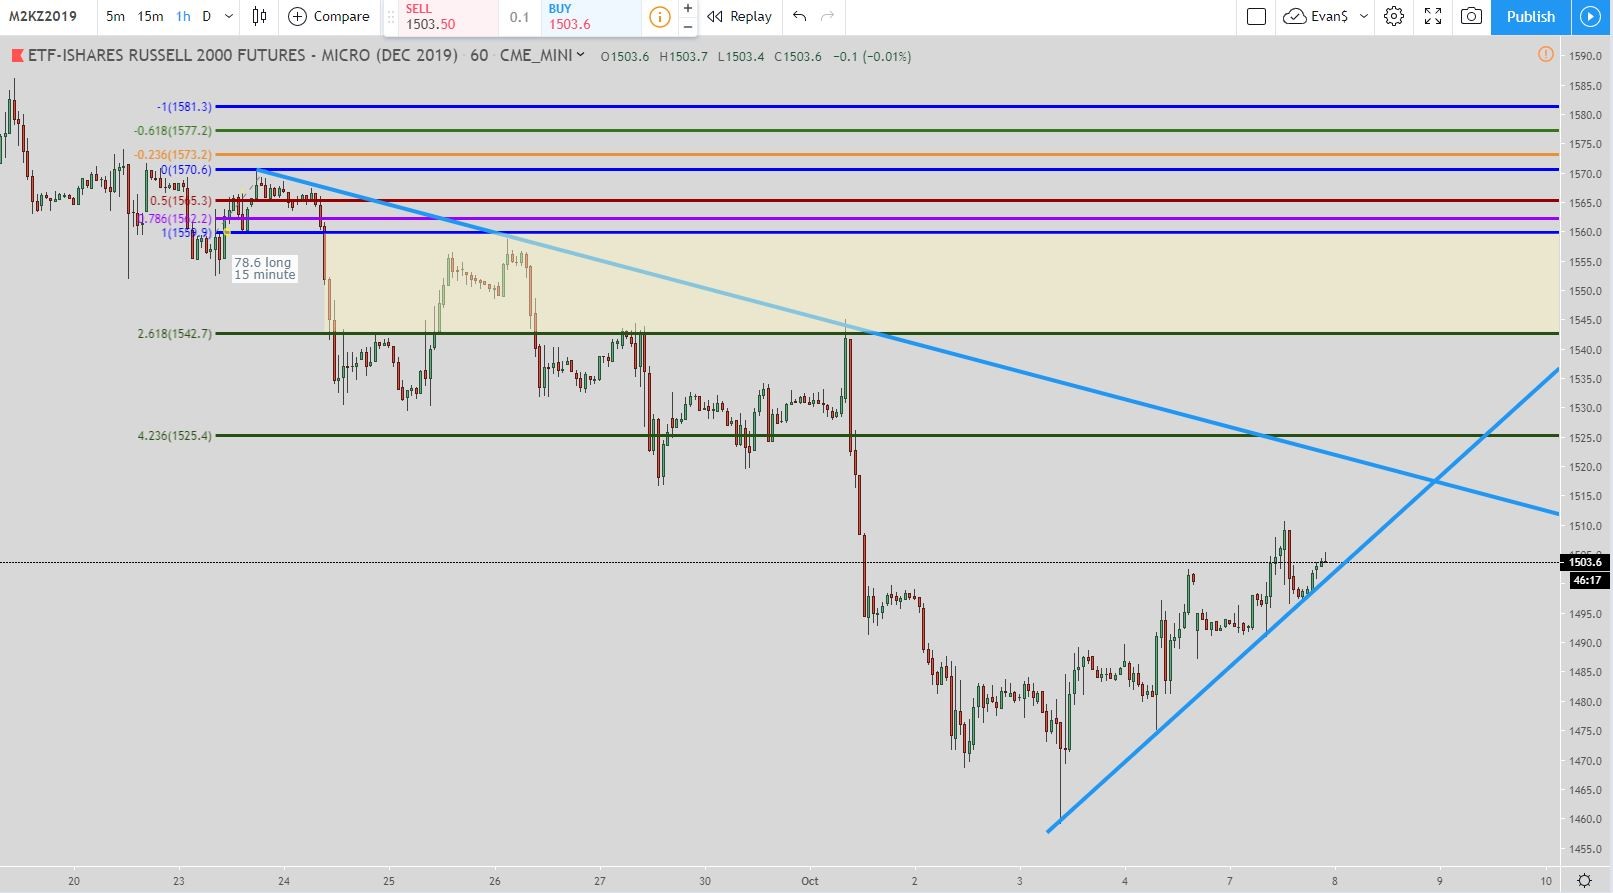
Here in the Russell 2000 chart, we are looking at the 1-hour time frame. This is a setup I got in today. As you can see the price found a little support around the 423.6% level but it was short-lived as the Russell 2000 continued to move lower. It finally found support and is now moving back up.
The exit is the top of the yellow box (or the 100% Fibonacci retracement level) at around 1560. Now, just to have full transparency, this is a trade I am currently in. I am long.
The exit I have is at 1557 because like I’ve said numerous times, I always get out early before the hard exit. I’ve seen the price go up and tick the exit which would complete the setup but not enough contracts would have been traded to get me out of the trade. So that is why I always get out early to ensure I get filled.
This trade has great potential and is providing excellent value at how far it has fallen. So for the intermediate to short term, I am bullish on the Russell 2000.
Video for The Stock Market Today (S&P 500, Nasdaq Futures Live, and Dow Futures Live)
If you cannot view the video then click on this sentence to be taken to it.
Conclusion for The Stock Market Today
Hopefully, the reviews of these charts will help you out. I don’t expect you at all to take what I say as gospel. This is how I view the market and how I trade.
As you have seen, I recently got out of the S&P 500 trade where I was long and got into the Russell 2000 trade on the long side. So in the short to intermediate-term, I am bullish for pretty much all of the US markets.
But some topping action has started so it will be very interesting to see what happens in the upcoming days and weeks to the markets. Like I mentioned at the beginning, the Democrats are stopping at nothing (and I mean nothing) to try and impeach President Trump. They have admitted numerous times publically that this is the only way to stop him from being elected a 2nd term.
If they somehow pull this off then the markets will take a big hit but they don’t care about that. Anything to get President Trump because according to them, “Orange Man Bad.”
If you would like to see any other markets covered please let me know and I will be glad to do so. If it is trade-able then I’ll be glad to review it based upon my trading setups. But the S&P 500, Nasdaq, Dow Jones, and Russell 2000 are the major ones in the US that most people who read my blog care about.

