Hey what’s up everyone, this is Evan Carthey from https://EvanCarthey.Com. Today we are going to look at the S&P 500 technical analysis for the week of August 18, 2019, or rather the ES Futures. As always if there are any stocks, Futures, Forex, or cryptocurrencies you would like to see me go over then let me know and I’ll be glad to do it.
Basically, if it’s tradable and able to do some type of technical analysis on a chart then I’ll be glad to do it. It’s what I love to do.
So on https://evancarthey.com I have tons of other stuff regarding meditation, book reviews, and how to meditate because I believe that that is the reason why I have discovered how to be profitable.
I don’t have anything to sell and I’m not trying to have you spend thousands of dollars on a trading course. I just want you to learn for yourself what makes you a profitable trader. My view is through meditation and meditating and you can definitely discover the trading system that works for you.
Here is the (bonus chart included in the video) video I created that goes over all of the charts I will list below:
S&P 500 Technical Analysis Looking at the Charts

Currently what we are in right now is an uptrend and there are the main trend lines you can see in the picture above. They are the purple lines. Until price breaks out the top, we are solidly in an uptrend.
When price breaks out of the top then it will eventually come and break down to the bottom. It doesn’t always happen right away but it will eventually happen. But right now we are squarely in an uptrend. Of course, the price doesn’t have to break out to the top before breaking down to the bottom.
Because when the price breaks out of the bottom and closes a bit lower then that uptrend move using those trend lines is over. I just like to see if the price has broken to the upside out of the trend lines because that can be a signal that the price has moved too far up too fast and a move lower will happen soon.
It doesn’t always happen but it is a good barometer. There are plenty of times the price breaks above the trend lines and makes a huge move up before breaking to the bottom of the trend lines which is why I do not use trend lines to trade.
I only use them as a guide.
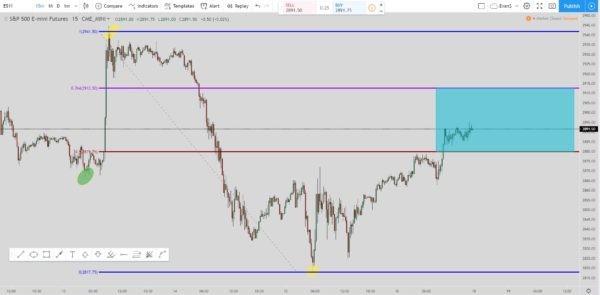
This next setup is the 76.4% short setup. We are waiting for the price to go up and hit the 76.4% line which is the purple line and also the top of the teal box.
Once it hits 2,912.50 then that starts the short. The exit is the bottom of the teal box or the 50% Fibonacci retracement red line at 2,879.75.
But if the price does not hit that exit but continues to go up and hits the 100% retracement level at 2,941.50 then the exits move to the 76.4% line at 2912.50.
For the last time, the exit could move it would take the price to go up all the way to the 261.8% Fibonacci extension level at 3,142. That is not visible in the chart above.
If the price goes up to that level without the exits I listed previously of being hit then the exit would move to the 2,941.50 price level which is also the 100% Fibonacci retracement level.
But if one of the exits is filled before an entry-level is hit then you do not get in at those entry levels. The move is over and it is time to look for another setup.
The S&P 500 technical analysis for the week of August 18, 2019 Final Chart Analysis

For the final chart for the S&P 500 technical analysis for the week of August 18, 2019, we are using the top pivot of 3029.25 and the bottom pivot of 2775.25. We have a 76.4% short setup we are waiting to kick off. The price must first go up and hit the 76.4% line at 2969.25. Once the price does that then the exit is the bottom of the teal box at 2902.25 which is also the 50% Fibonacci retracement level.
But if the price doesn’t hit that exit and then goes up and hits the 100% level at 3029.25 then the exit moves to the 76.4% level at 2969.25.
Finally, if the price continues to take off and hits the 261.8% Fibonacci extension level (not pictured) at 3,440.50 then the exit moves to the 100% level at 3,029.25. That would be an EXTREME move and I highly doubt that happens.
It would take some extraordinary move for that 261.8% level to be without either of the other two exits first being hit. As always, if an exit is hit then the move is over. You do not look to get in at any of the other unfulfilled entry levels. It is time to look for another setup.
The conclusion to S&P 500 technical analysis for the week of August 18, 2019
For the S&P technical analysis for the week of August 18, 2019, I am looking for the market to go to the upside to start the week. Once the price starts hitting some of those short setups then we will see what happens with the market.
Will those initial short entries be enough of a stopper to cause the market to retrace to complete the exits?
Or will they be a tiny bump in the road to a higher move before the retracement of the move to fill the exits? But I do think the market will be higher at the beginning of the week in order to signal those short moves at the levels I wrote about.
For over 10 years I read countless books, watched hundreds of hours of trading videos, and spent thousands of dollars learning from “gurus” who were nothing more than a rip-off. It wasn’t a friend showed me to look into my subconscious mind and learn from that for my trading did I become a profitable trader.
That doesn’t mean I quit making mistakes and still have losing trades. I still do. I am learning every day and will continue to do so until the day I die.
But what meditation showed me that by tapping into my subconscious mind I can find out what trading styles and systems work for me. Then I adapt it to maximize its profitability for myself.
This is what anyone can learn to do and I hope that from reading my blogs and watching the videos that you can learn to create your own trading style that works for you.

