Oil (CL) Technical Analysis for the Week of 2/17/2019 – 15 Minute and Daily Chart
Today I am looking at Oil (CL) for the week of 2/17/2019. I will look at the short term in the 15-minute chart and the long term with the Daily chart. Earlier this week price came back and took out a short setup which is great if you are bullish on oil. For long term I am very bullish with oil and look for it to reach $69 as the next big target to the upside.
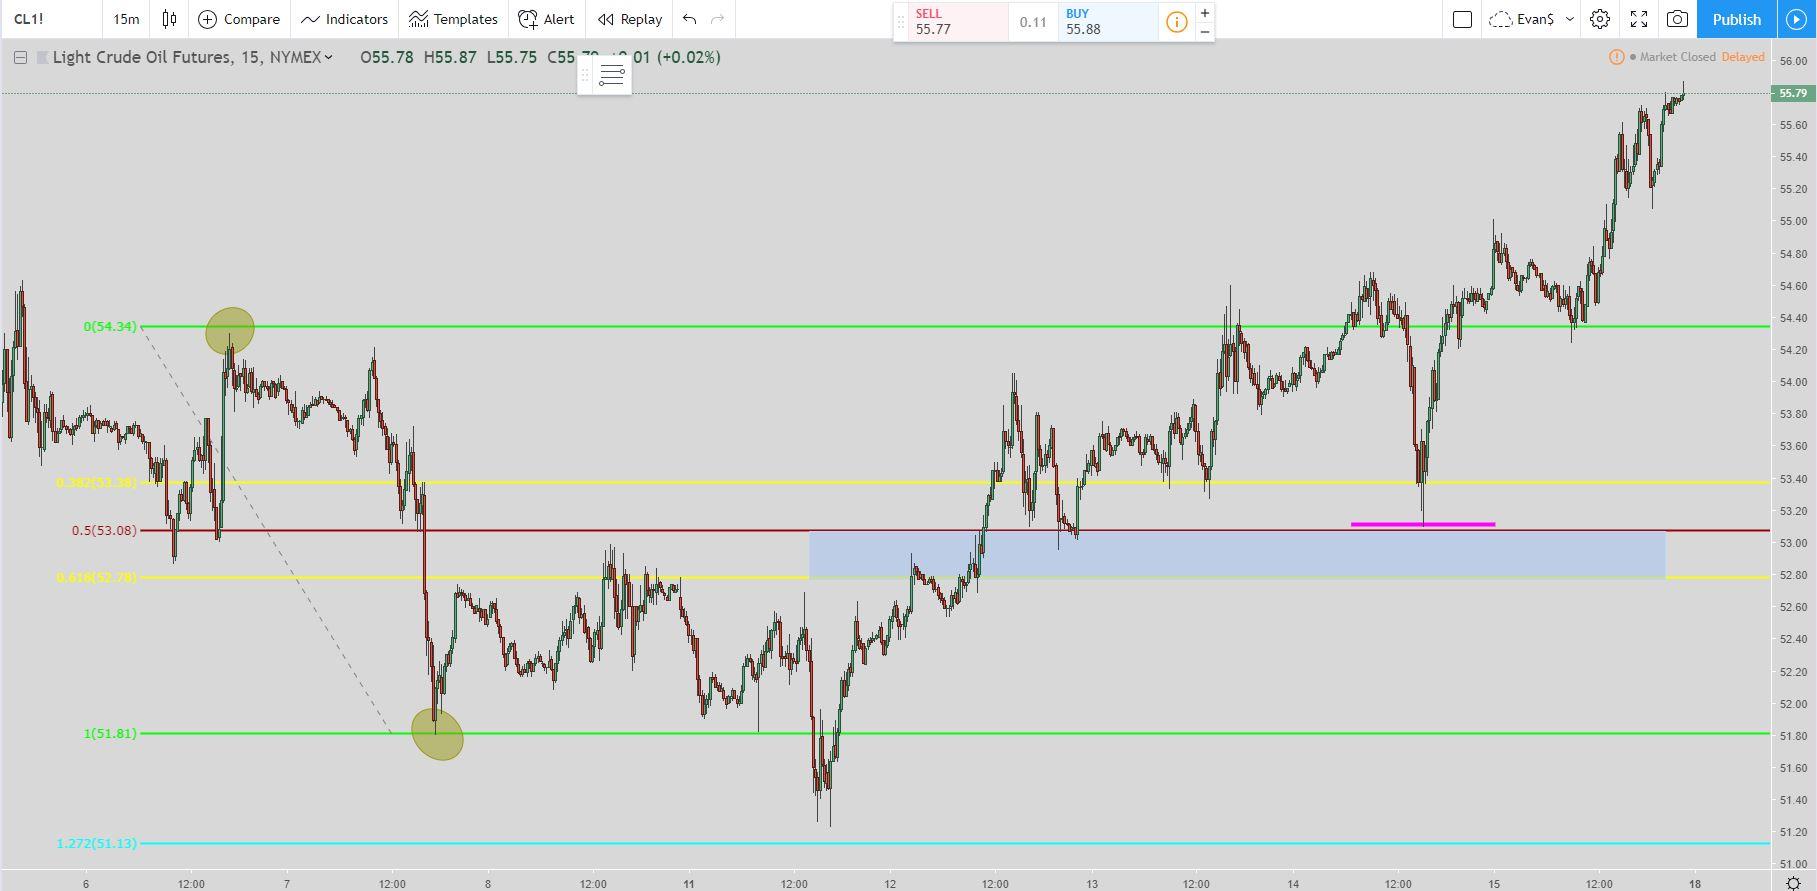
From the chart above you can see how price perfectly came back and hit the pink line which was the exit for the short setup. The chart used is the 15-minute chart. So for the short term that is excellent to get the short move out of the way. Now there looks to be a bullish upside potential since the short setup is now complete.
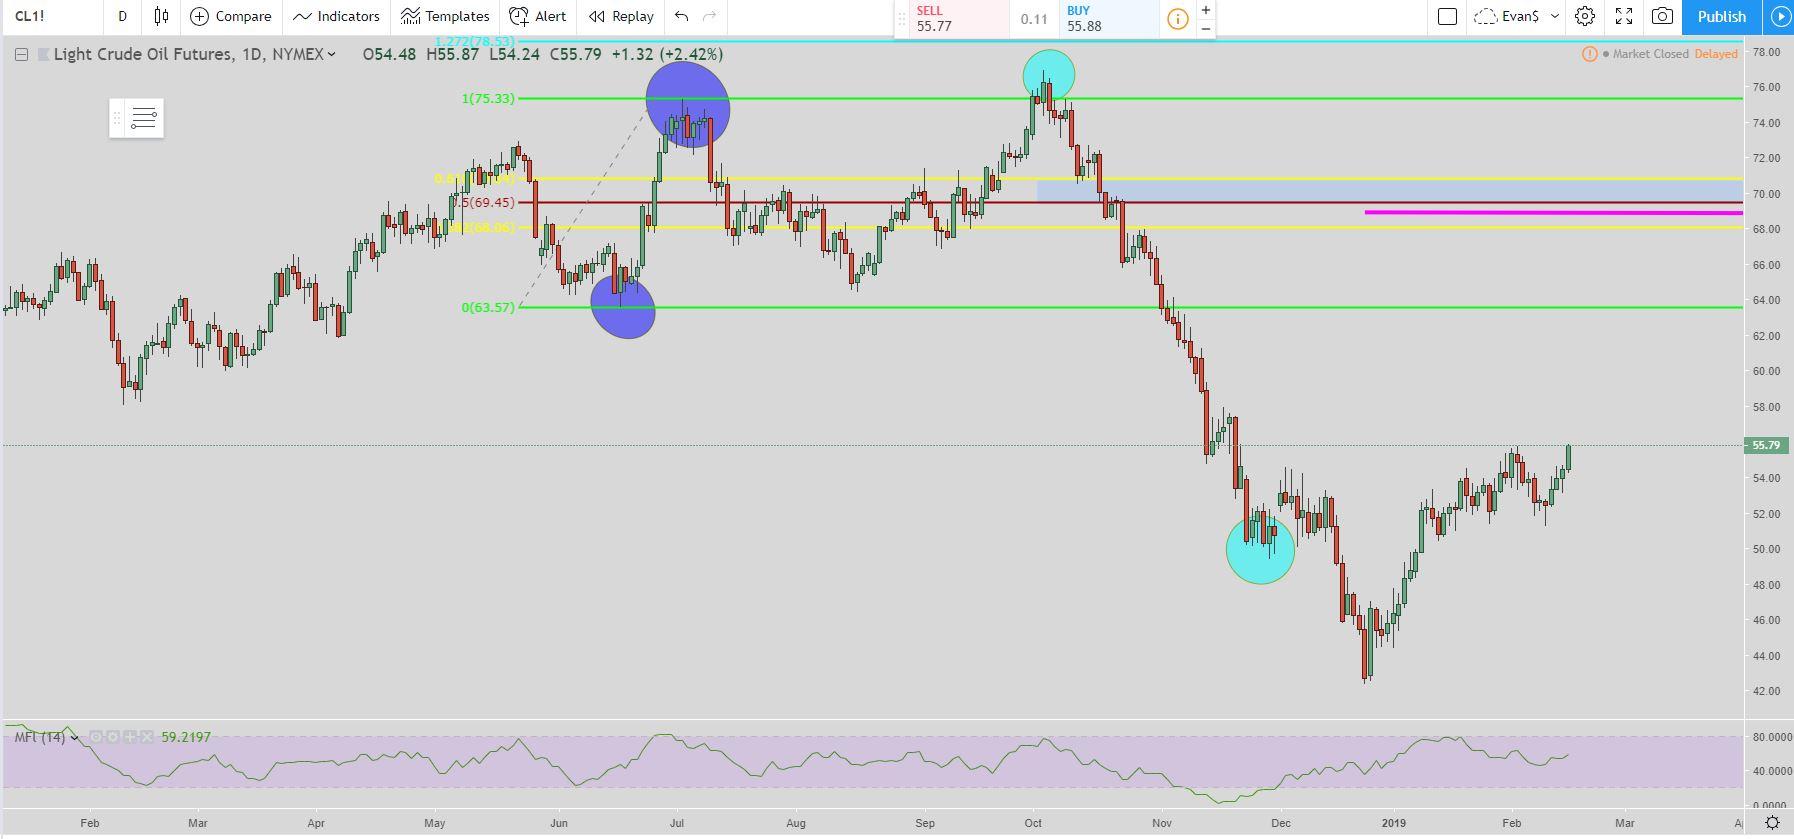
In the daily chart I am extremely bullish long term on oil The pink line is the exit I am looking for to eventually hit. The teal circles are a short setup that has developed which is worth monitoring.
In a worst case scenario price could go back down into the low 40s. But right now that doesn’t look like it is going to happen. It doesn’t mean it couldn’t happen but is something to watch for.
In the video below I go over the different levels and what I am looking for. If price hits a certain level then it will move the exit up and we should avoid the low 40s in oil for a while.
Video
Recap
For both the short term and long term I am bullish on oil. In the 15-minute chart, I am waiting to see what happens for another setup to take place. Right now it has a little bit more to go to finish another long setup.
The short setup for the 15-minute chart was completed this week that opened it up to more room to the upside which it did. So far there are not any short setups to worry about to the downside so that is great news if you are bullish on oil.
For the daily chart, I am extremely bullish on oil. In the video above I list the levels and what to look for. If there is weakness in oil or oil stocks then it is a great opportunity to purchase them.
Remember that the information provided is my opinion and should not be taken as financial advice.
If you would like to see me go over anything I will be glad to, just let me know. I view the markets based upon my own trading setups and how I trade.
If this post benefits you and if you haven’t used Robinhood for trading stocks but are thinking to then please consider using my referral link when you do sign up: http://share.robinhood.com/evanc203.
This way each of us will receive a free share of a random stock if you sign up through my referral link.
My Robinhood Review: https://evancarthey.com/review-robinhood-trading-service-with-no-fees-part-1/


