Today I went long on the AUD/JPY. This article will show you how to make money trading the AUD/JPY. I will show you the setup I use, my current entry, the exit, and anything else that will need to be utilized but that is almost all of it. We will be using the 4 hour chart. As of right now (6:53pm CST) you can still get in at a very good level with protection in case the trade goes against you.
If you haven’t used Robinhood for trading stocks (they don’t offer forex) but are thinking to then please consider using my referral link when you do sign up: http://share.robinhood.com/evanc203.
This way each of us will receive a free share of a random stock if you sign up through my referral link.
My Robinhood Review: https://evancarthey.com/review-robinhood-trading-service-with-no-fees-part-1/
The Setup
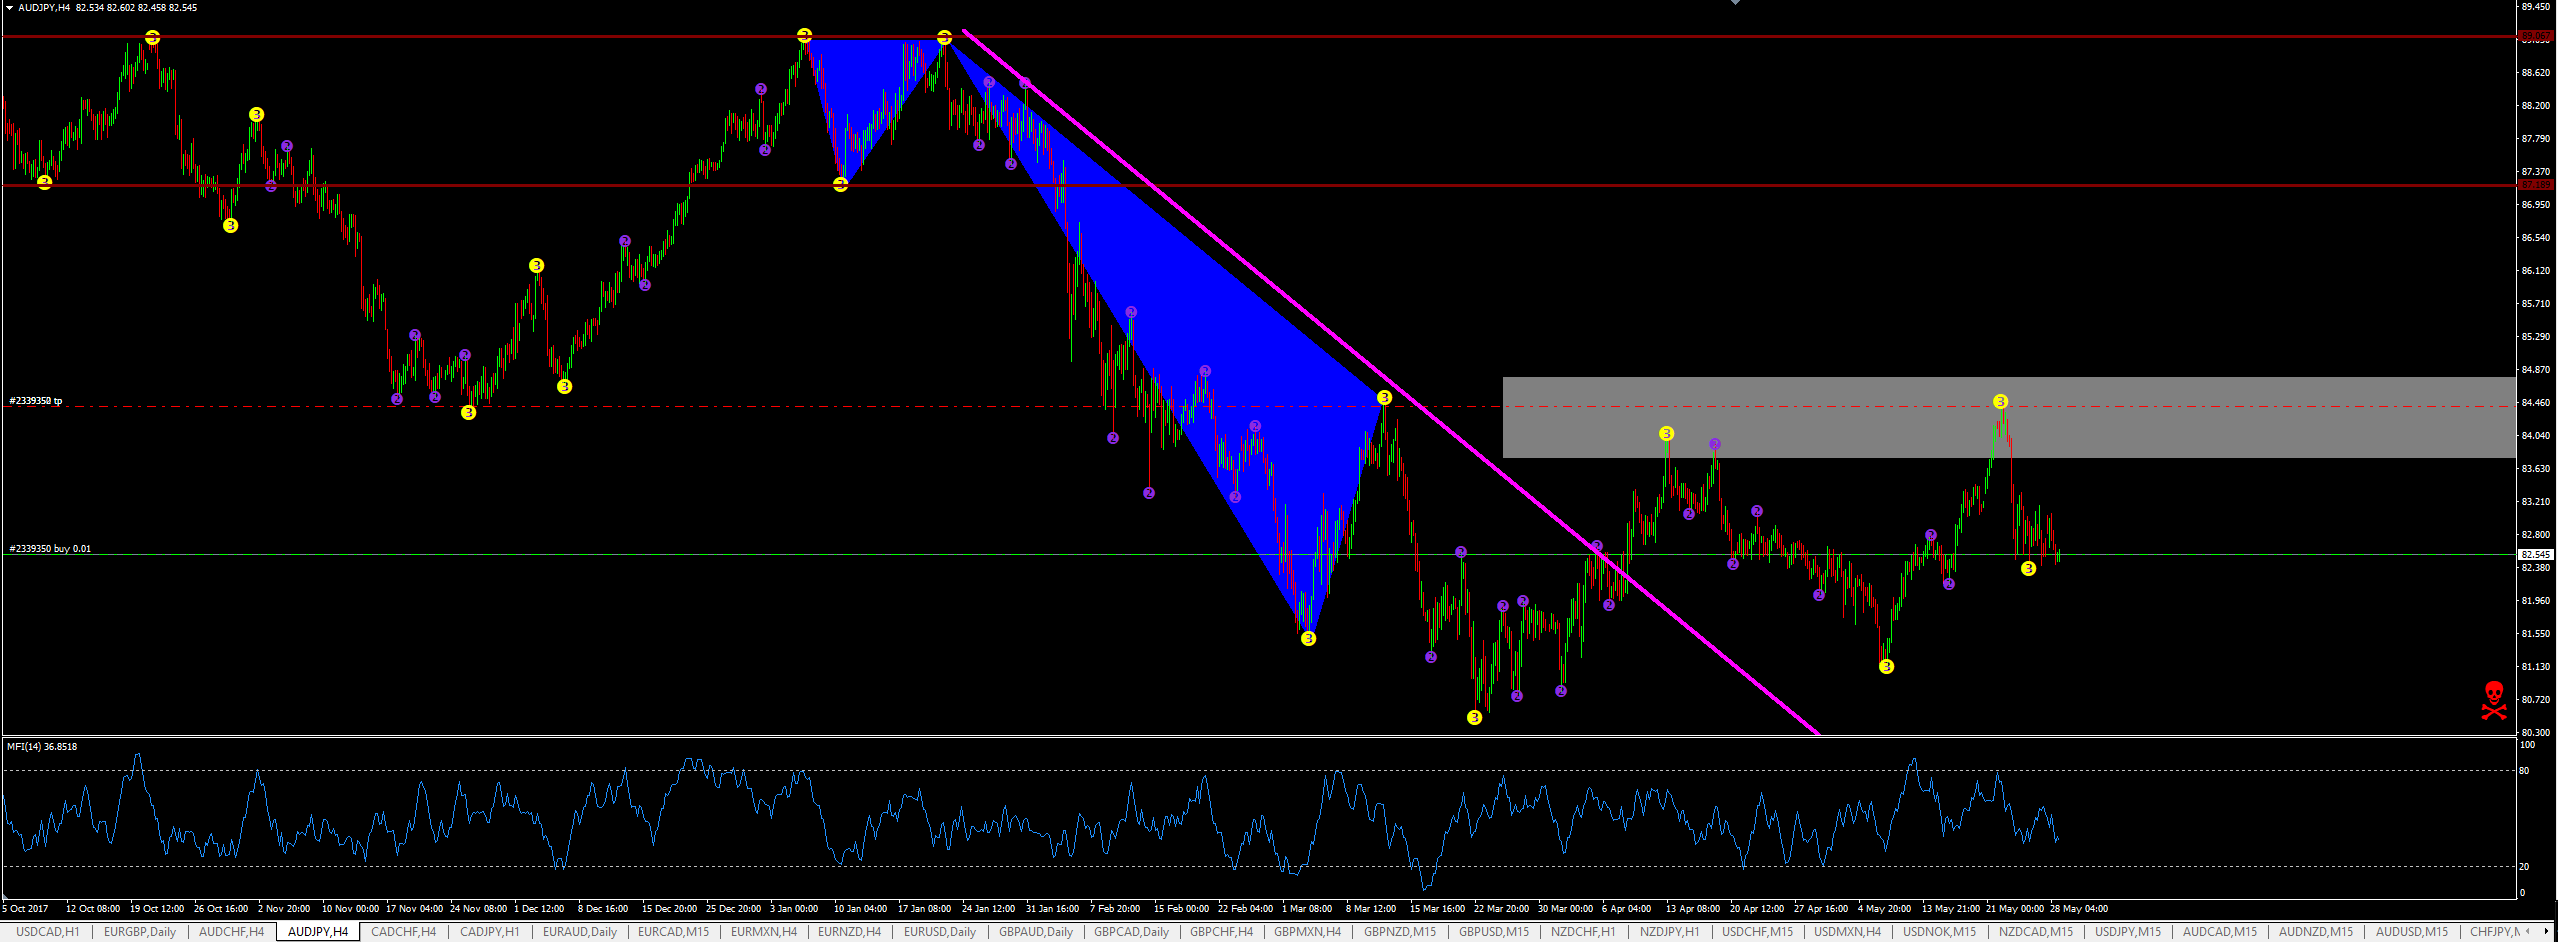
Here you can see the setup I am using to make the trade. The top of the gray box is the 50% Fib retracement level and the bottom is the 38%. My exit is just below the top of the gray box. The magenta line is the trend line that has been broken. Price has come back and retraced not once but twice.
As soon as price hits the to of the gray box then I am out of the trade. That is why I have my exit just below it in order to give it some wiggle room. I try not to be too greedy.
At the top you see the two blue triangles. The solid red lines help me recognize the levels and make it easier to draw the Fibonacci retracement and extensions off of. I am using the smaller blue triangle to draw the Fibonacci extensions off of and the Fib retracement level is pretty much the same from both levels up top of the blue triangles.
As you can see price broke out of the magenta trend line and that is the signal to go long. Like price does a lot of the time it retraced back to at least 61% of the low. That isn’t a requirement to go long but it tends to get you in at a better price. Sometimes price sky-rockets and never retraces. But it seems like it does more often than not which increases my profit.
Fib Extension Levels for the AUD/JPY
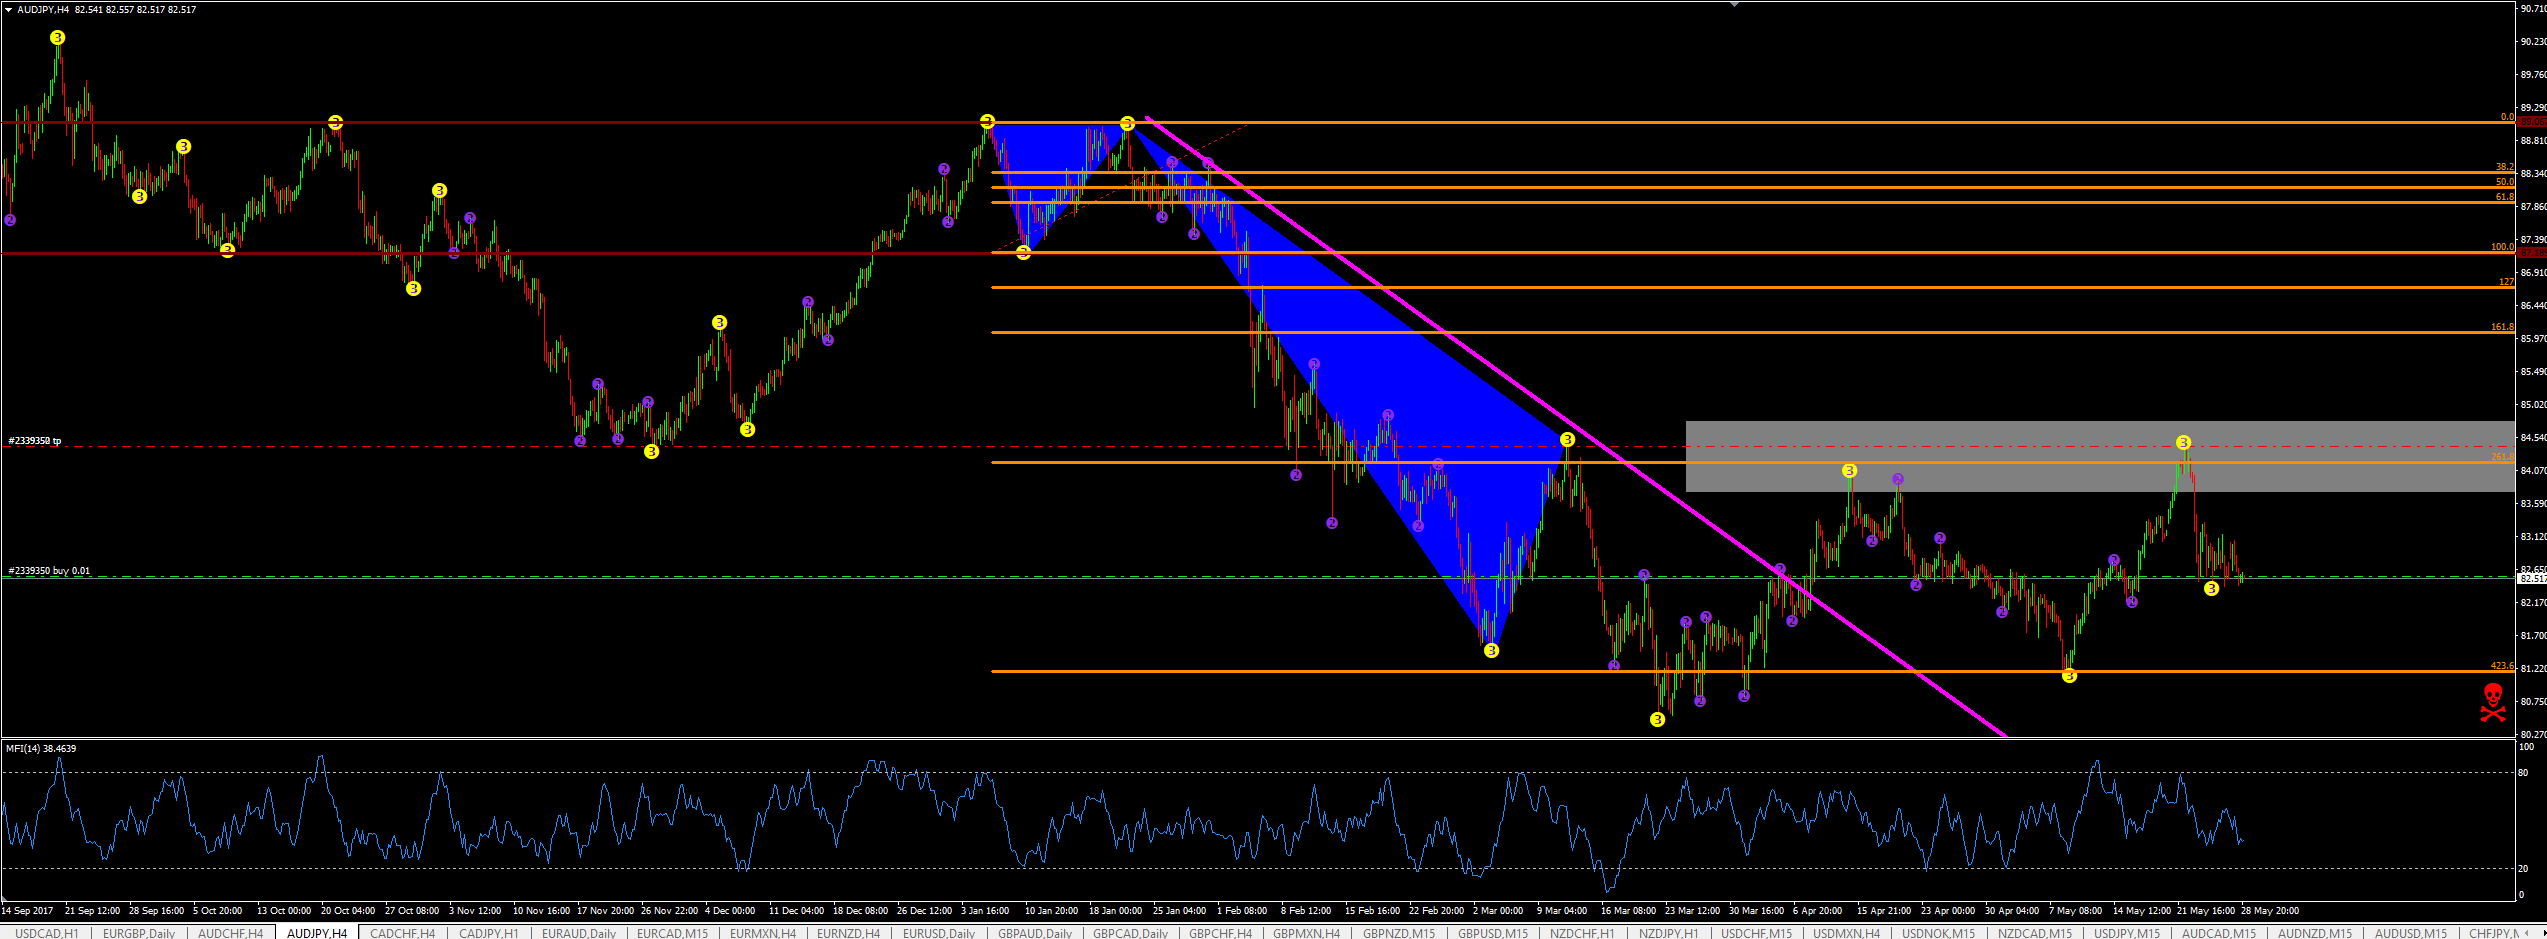
Here you can see where I drew my Fib extensions from the price of the AUD/JPY. Price is currently between the 261% and 423% so it is in a good spot after breaking the trend line. I try not to get in a trade where price isn’t at least past the 161% Fib extension level. From my experience that is a good spot where if price moves against you then you still have plenty of room before you have to add on.
The yellow dots are a basic pivot point indicator I use that identifies the pivot points. It repaints so don’t think you can use it to spot tops and bottoms.
Next Add-On Level
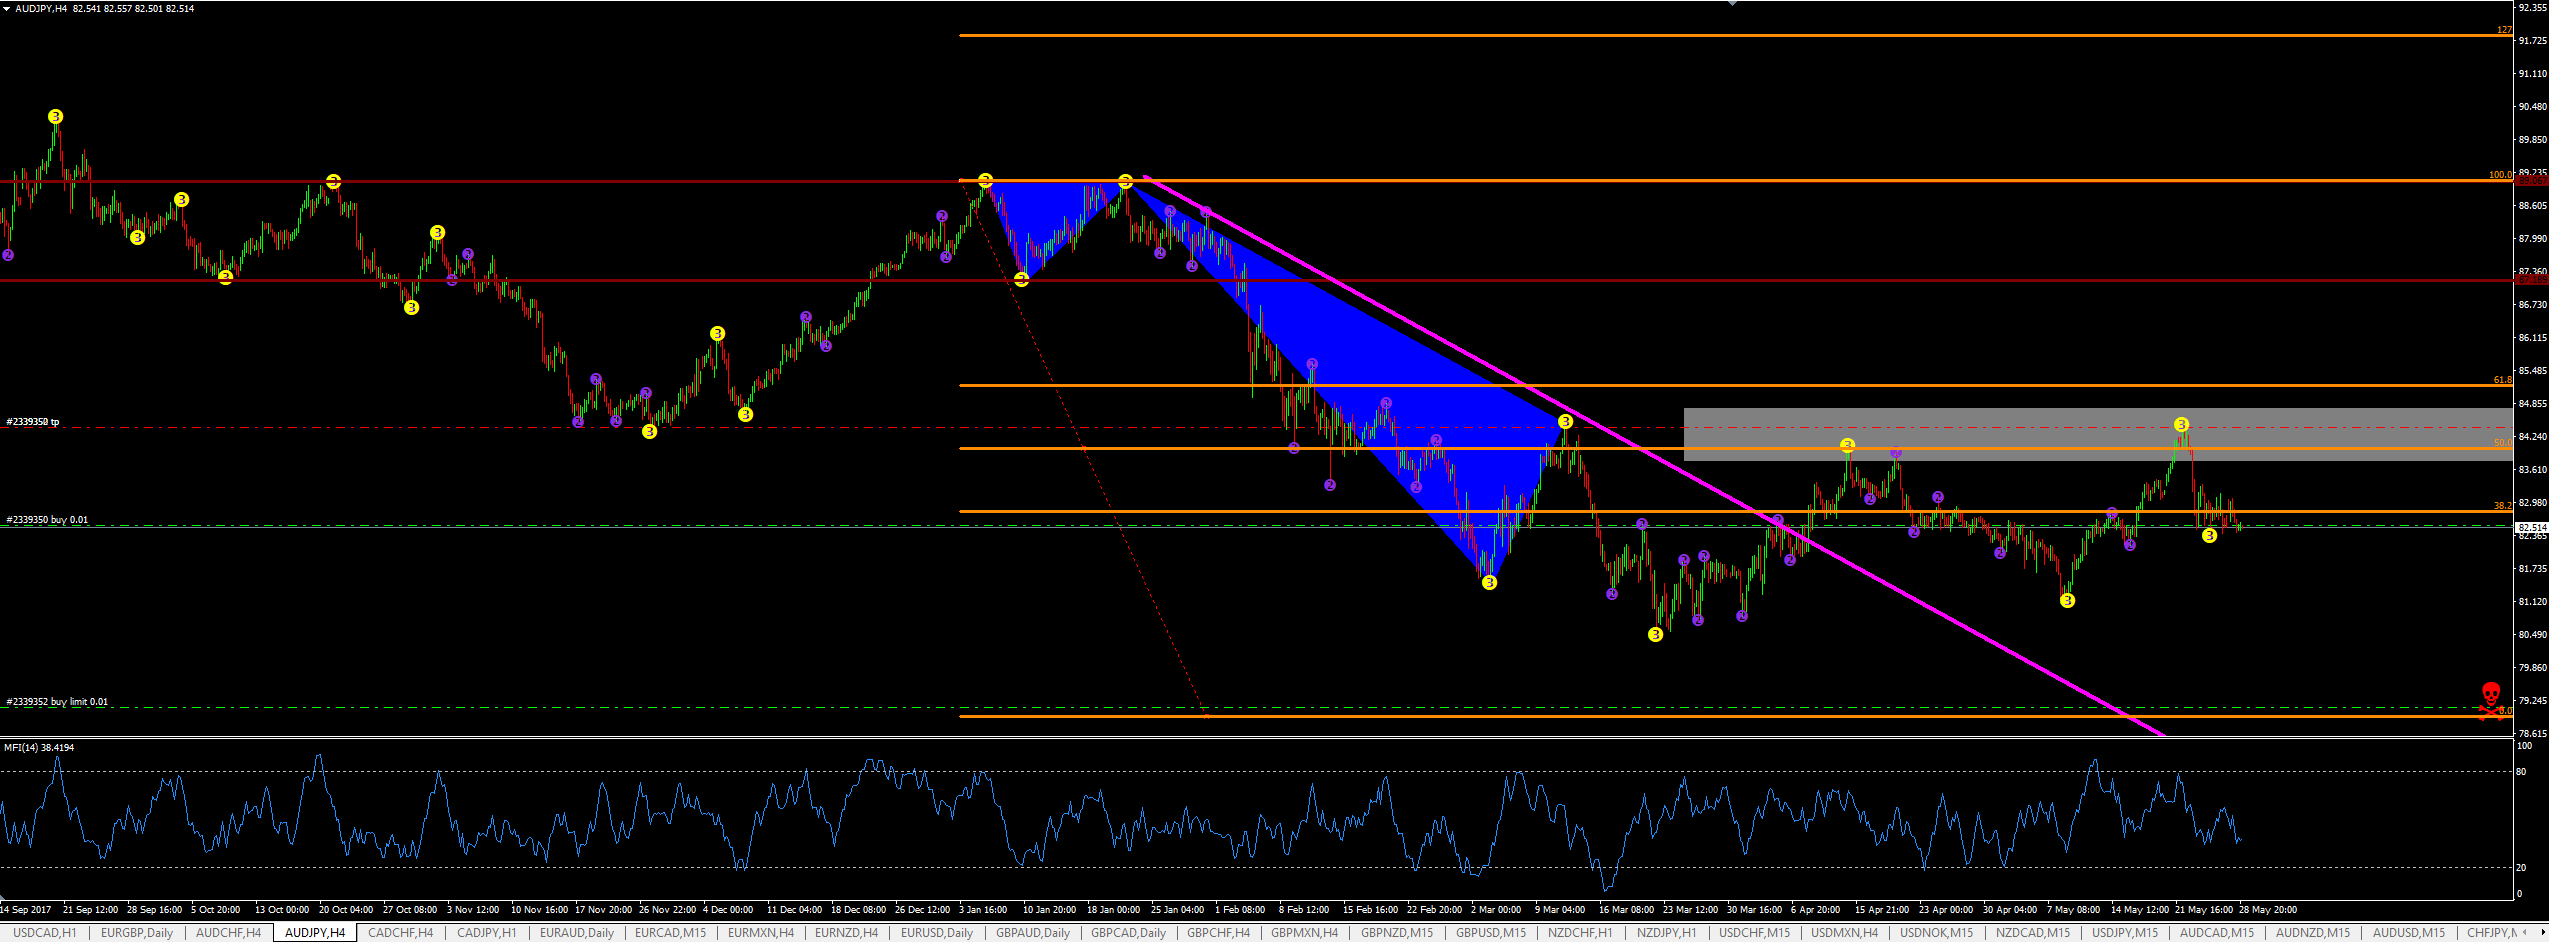
If price continued to move against me then I would add on at 79.119. This would be just shy of my original entry that would be around the 38% Fib retracement level. This would still give me a little profit with my original entry while giving very nice returns on the 2nd entry. If price continued to move against me then I would move the Fib retracement lower and get in at 76.342. This would give me a slight loss on my 1st entry, but a good win on my 2nd and an even better on my 3rd.
All I do is drag the Fib retracement tool down and make sure that each entries give me room to make a good return overall. The exit gets moved to just below the 50% Fibonacci retracement level. This is how I exit the majority of my trades. Sometimes I get out earlier if the Daily chart of the Money Flow indicator shows price to be above the 80 level. When that happens on the daily chart then price usually retraces. It doesn’t always do that but when it does I’ve found it gives me an opportunity to exit and then get back in at a better level to make another profitable trade.
Conclusion
I am long at 82.519. My exit is at 84.403. If price moves against me and creates new lows then I’ll get in at 79.119 for my next entry. You can still get in near where I got in.
The swap is positive (I use Forex.com) at 0.20 which is important. 4 hour chart trades can take days/weeks/months to complete and having a positive swap on your side ensures money will be flowing into your account and not out.
I try to ONLY take trades that has a swap in my favor. The only time I don’t is when I trade off of the 15 minute charts.
P.S. – If you are looking for a great book on how to draw trend lines then check out:


