Trading the forex market can seem difficult and daunting but it actually provides the easiest and most consistent setups. The USD/MXN (USDMXN) can seem like a hard exotic pair to trade but it is actually pretty easy. I am already short the GBP/MXN and the EUR/MXN. The USD/MXN is the next pair to drop. Currently it isn’t quite ready yet but this post will get you ready for when you need to short and what level to exit.
If this post benefits you and if you haven’t used Robinhood for trading stocks (they don’t offer forex) but are thinking to then please consider using my referral link when you do sign up: http://share.robinhood.com/evanc203.
This way each of us will receive a free share of a random stock if you sign up through my referral link.
My Robinhood Review: https://evancarthey.com/review-robinhood-trading-service-with-no-fees-part-1/
The USDMXN Chart Setup
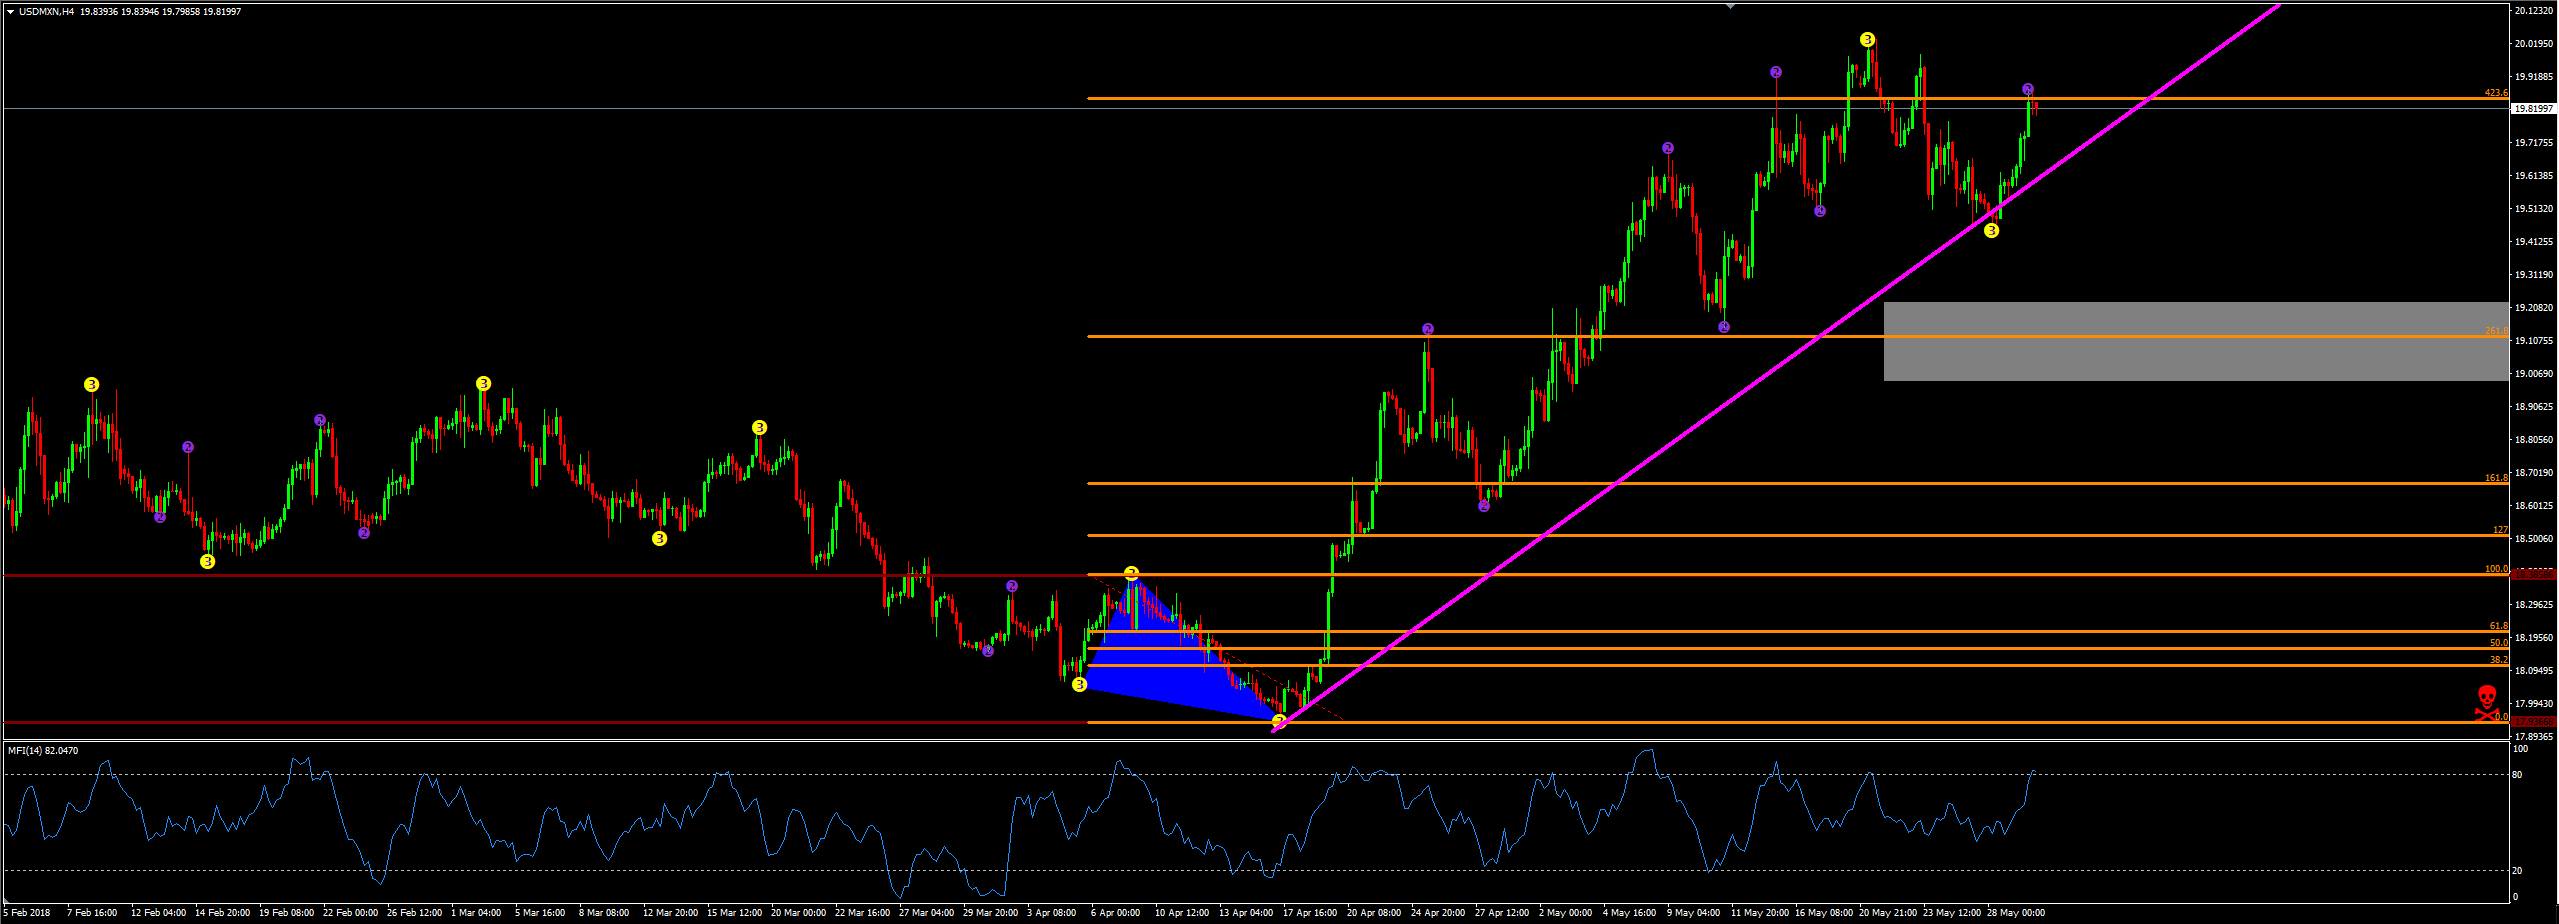
We are looking for price to close below the magenta line. When price does this then that is our signal to go short. Price has already bounced off the 423% Fib extension level. At the time of writing this it is hitting off of it again. We are still waiting for the break of the magenta line which is the trend line. The time frame I am using is the 4 hour chart. It currently has a positive swap which is important when using a 4 hour time frame. This trade can take days, weeks, or even months.
That is why I always make sure I am using a pair that has a positive swap for the direction I am looking to trade. You’ll slowly receive a little bit extra cash each day deposited into your account. If the short for the USD/MXN has a negative swap then it would drain your account slowly each day. The only time I don’t really worry about a negative swap rate is when I am using the 15 minute time periods on my charts. I still make sure the swap isn’t too ridiculous but those moves are usually completed in a couple of days at the most so the negative swap rate is minimal.
Wait for a retracment to enter the USD/MXN?
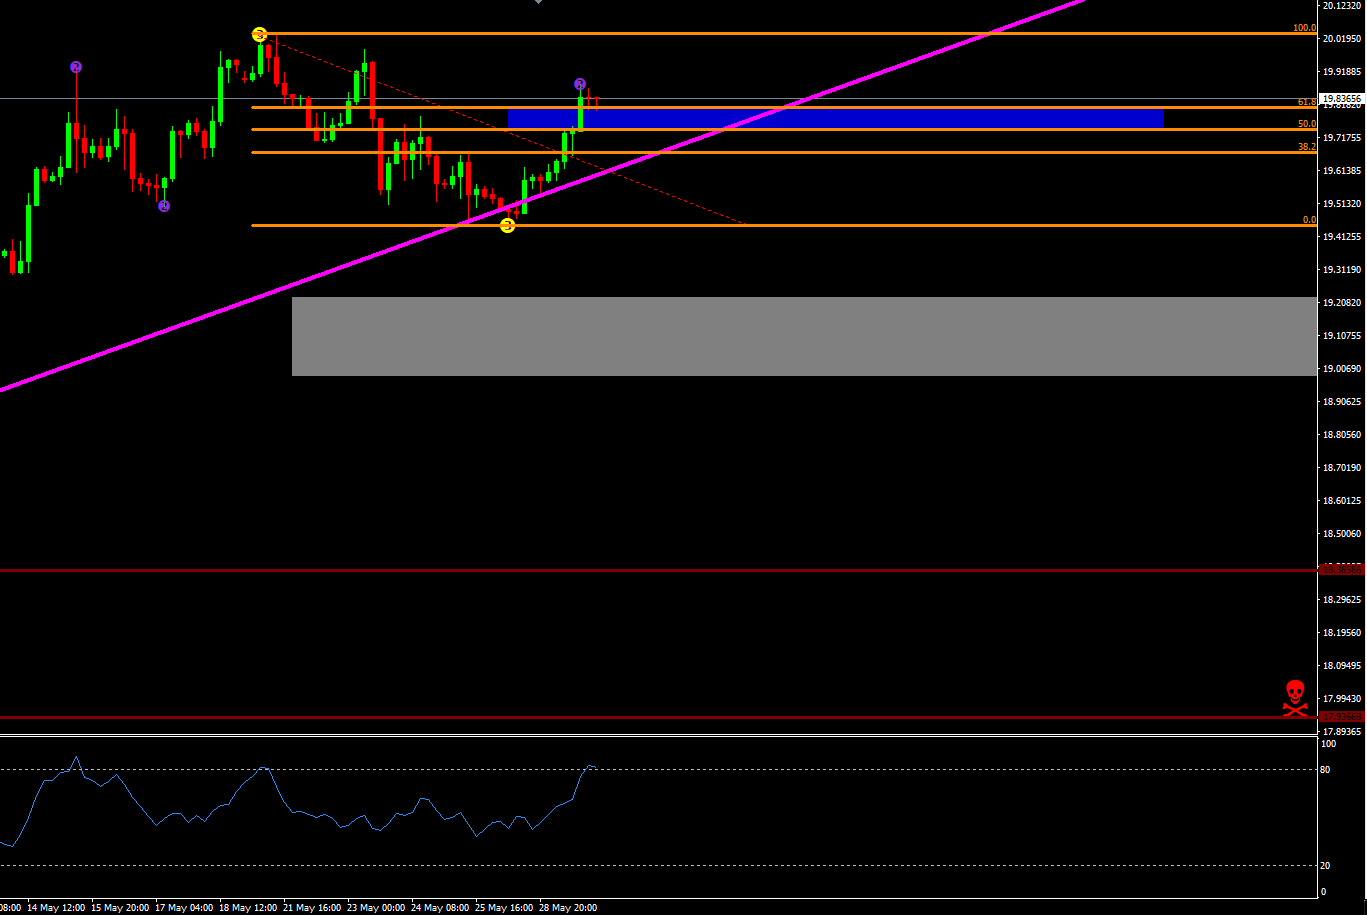
If you want to wait to get in at a better price then you could get in around the 50%-61% Fib retracement level. What that means is we wait for price to close below the magenta line. Then we take the entry when price retraces back around the 50%-61% Fib retracement level. This picture above shows the entry level IF price had broken out of the magenta line. It did not so we are still looking for it to do so. We are waiting. The blue box is the 50%-61% retracement level IF we were looking to enter on the retracement if the current high holds.
Sometimes price doesn’t give you this opportunity but many times it does. It is your own call to enter right when price breaks or to try and wait for the retracement. I will probably get in when price breaks the magenta line. But it depends on how far down price is when it breaks. If price is under the 161% Fib extension then I will wait for the retracement for a better entry.
The Exit for the USDMXN Trade

If the high remains around 20.02497 then my exit will be just above the bottom of the gray box. That price is 19.02998.
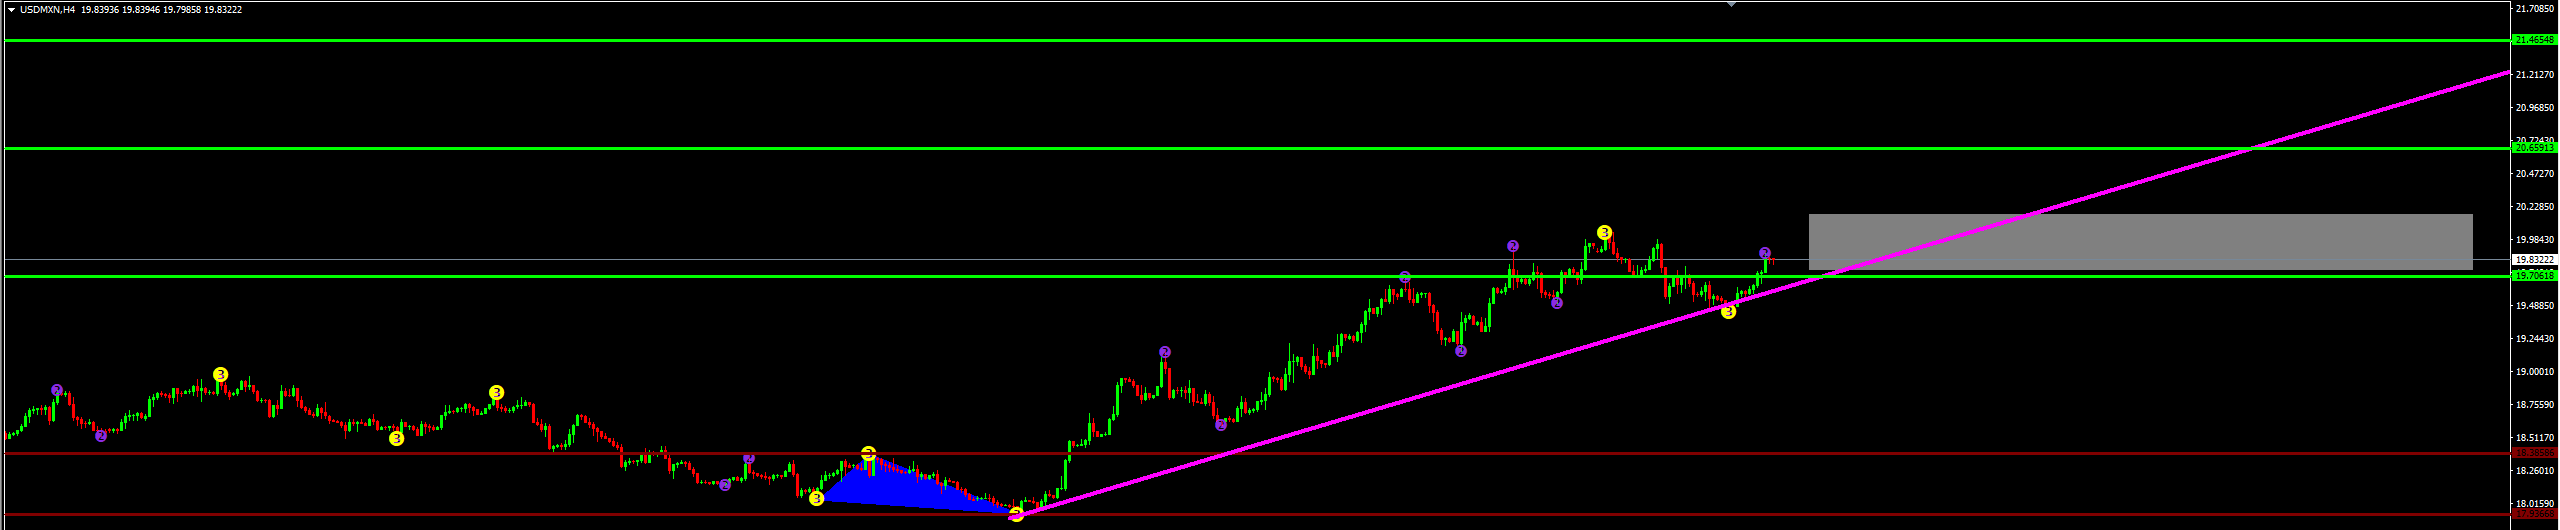
Here is a chart that shows my next two entries if price goes well north of the last swing high and I was already in the trade. The lime-green lines would be my entry levels IF I was already in with the lowest lime-green line as my initial entry. With price breaking out of the magenta line on a 4 hour chart you usually do not have to worry about price taking off against you. It can and does happen but since I am waiting for the break of the trend the big move up should be over. This is why it is very important to wait for the break. My exit would be just below the bottom of the gray box assuming price didn’t move much higher than my 3rd entry (the 3rd lime-green line).
I just wanted to show that as an example if price goes wayyyyy against my initial entry. The good news is since now I wait for the break I don’t get in wayyyyy too early anymore. I do miss out on some quick trades but it keeps me safe against the big moves.
The break is a great sign that the trend is over and the retracement has started. This does not happen every time but one of the best aspects is that I won’t get in at a worse price. I used to get in blindly at certain Fib extension levels. This worked most of the time. But when you had price take off on a huge move then you had to allocate a lot of leverage into one pair. Now we wait and then get in.
Conclusion
I am waiting for the USDMXN to close below the trend line and then I will go short. I am currently short the GBP/MXN and the EUR/MXN. The USDMXN is the next pair to drop. Currently it isn’t quite ready yet but this post hopefully provided a game plan if you were looking at how to trade the USDMXN.
The swap is in positive territory for a short which is very important when using a 4 hour time frame on your charts. This trade can take days or weeks or even months to complete. So having a positive cash flow for the swap each day allows money to slowly build up your account rather than draining it.

