This post will be the AON stock review in 2019 that will provide precise entries and exits in the technical analysis section if there are valid trades to be had. All setups are based upon the setups use in how I trade. We will also look at the fundamentals of AON to see if we can consider it to be a growth stock.
I do not currently own any shares of AON and have no plans to do so in the next 72 hours.
Here is the background on AON from Wikipedia:
Aon plc is a British global professional services company headquartered in London that provides risk, retirement and health consulting. Aon has approximately 500 offices worldwide, serving 120 countries with 50,000 employees.[2]
In 2011, Aon was ranked as the largest insurance broker in the world based on revenue.[3] Aon was the principal partner and global shirt sponsor of the Premier League team Manchester United F.C. from 2010 until 2014.[4][5]
Aon was created in 1982 when the Ryan Insurance Group merged with the Combined Insurance Company of America. In 1987, that company was renamed Aon, a Gaelic word meaning “one“.
Basically, AON is a professional service firm who provides a bunch of different insurance solutions. If you go to their homepage it is the standard mumbo jumbo corporate speak about them being the leader at this and the best at that. Plus they use proprietary data and analytics just like everyone else. In the world we live in today pretty much every major company uses the same phrases in order to not make waves. Then just like every other major company they say they are inclusive but yet diverse at the same time. Oh, and they also help their clients “go green,” whatever that entails.
Overall it is the typical boring insurance website you would expect from a major insurance company.
Fundamentals for the AON Stock
There are 7 fundamental markers I look for in a stock. I try to only purchase growth stocks so these are the parameters I look for to see if a stock meets the majority of the markers. I prefer to have all seven fulfilled. You can it more in depth here: https://evancarthey.com/how-to-scan-for-winning-stocks-an-insiders-view-to-my-process/
- Market Cap: > $300 million
- EPS growth past 5 years: >0%
- P/E: Over 10
- EPS growth next 5 years: >0%
- Sales growth past 5 years: Over 20%
- Debt/Equity: <0.1
- Sales growth qtr over qtr: Over 5%
Does the stock meet these 7 markers?
- Market Cap: 47.12B (YES)
- EPS growth past 5 years: 5.70% (YES)
- P/E: 38.93 (YES)
- EPS growth next 5 years: 11.69 (YES)
- Sales growth past 5 years: -1.80% (NO)
- Debt/Equity: 1.36 (NO)
- Sales growth qtr over qtr: 1.70% (NO)
I used Finviz.com for the fundamental analysis screener.
With the AON stock only hitting 4 of the 7 markers for what I consider to be a growth stock then this cannot be considered a growth stock. Please remember this is strictly based on the fundamentals. When we look at the technical analysis in the next section then the charts make the AON stock seem like an amazing growth stock. Basically, I use the fundamentals to make sure the stock isn’t a crap stock and is heading for bankruptcy in the near future.
Obviously, sometimes crap stocks slip through but the goal of the makers I use for the fundamental analysis is to filter out the crap stocks. I strive to look for stocks that meet all 7 of the markers but sometimes exceptions can be made. So when I have a stock that has 6 or 7 of the markers and fits my technical setups then I have a stock that I will probably trade.
Technical Analysis
Daily Chart
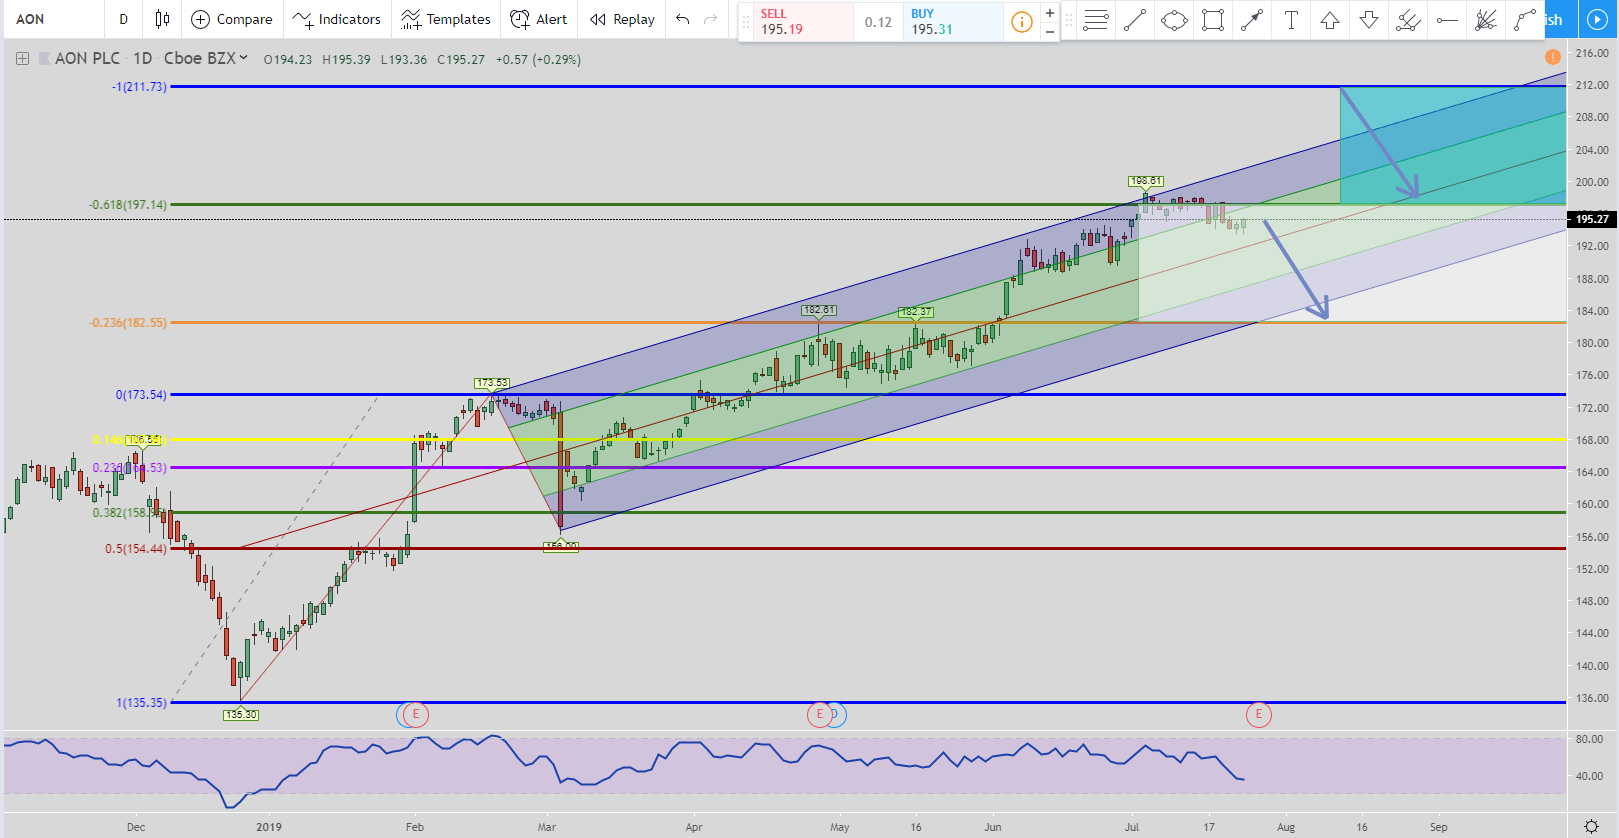
The first chart we are going to look at is the daily chart. From this setup it is the 123-161 short. Where the price of the AON stock is at the moment the exit is the bottom of the white box which is around $182.75. But if the price continues to go up before hitting the exit of $182.75 then you will need to get in another short entry near the 200% extension level which is the blue line or the top of the teal box. That is around $211.
But you only do this if the first exit of $182.75 is not hit. If it is then you do not get in at the 2nd entry level. So if the price does go up and you are able to get in at the 200% percent level then your exits move to the bottom of the teal box around $198. From there your exit does not move again. Even if the price continues to move higher than the 200% Fibonacci extension level you do not move the exit. It just means you can get in at even higher prices because eventually the price will come down and fulfill that exit level.
The setup used here is my 123-161 exit and it is one of my favorite setups. It is one of the 2 main setups I use. The other being the Springboard setup.
In the chart above I also added the Schiff Pitchfork to it as a trend line. The reason why is I wanted to show how the price of AON’s stock has been riding the upper band for awhile. The price action will show weakness when it breaks below the median line again (the red line in Schiff’s Pitchfork). The Schiff Pitchfork is a good barometer of where price is in a trend.
Weekly Chart
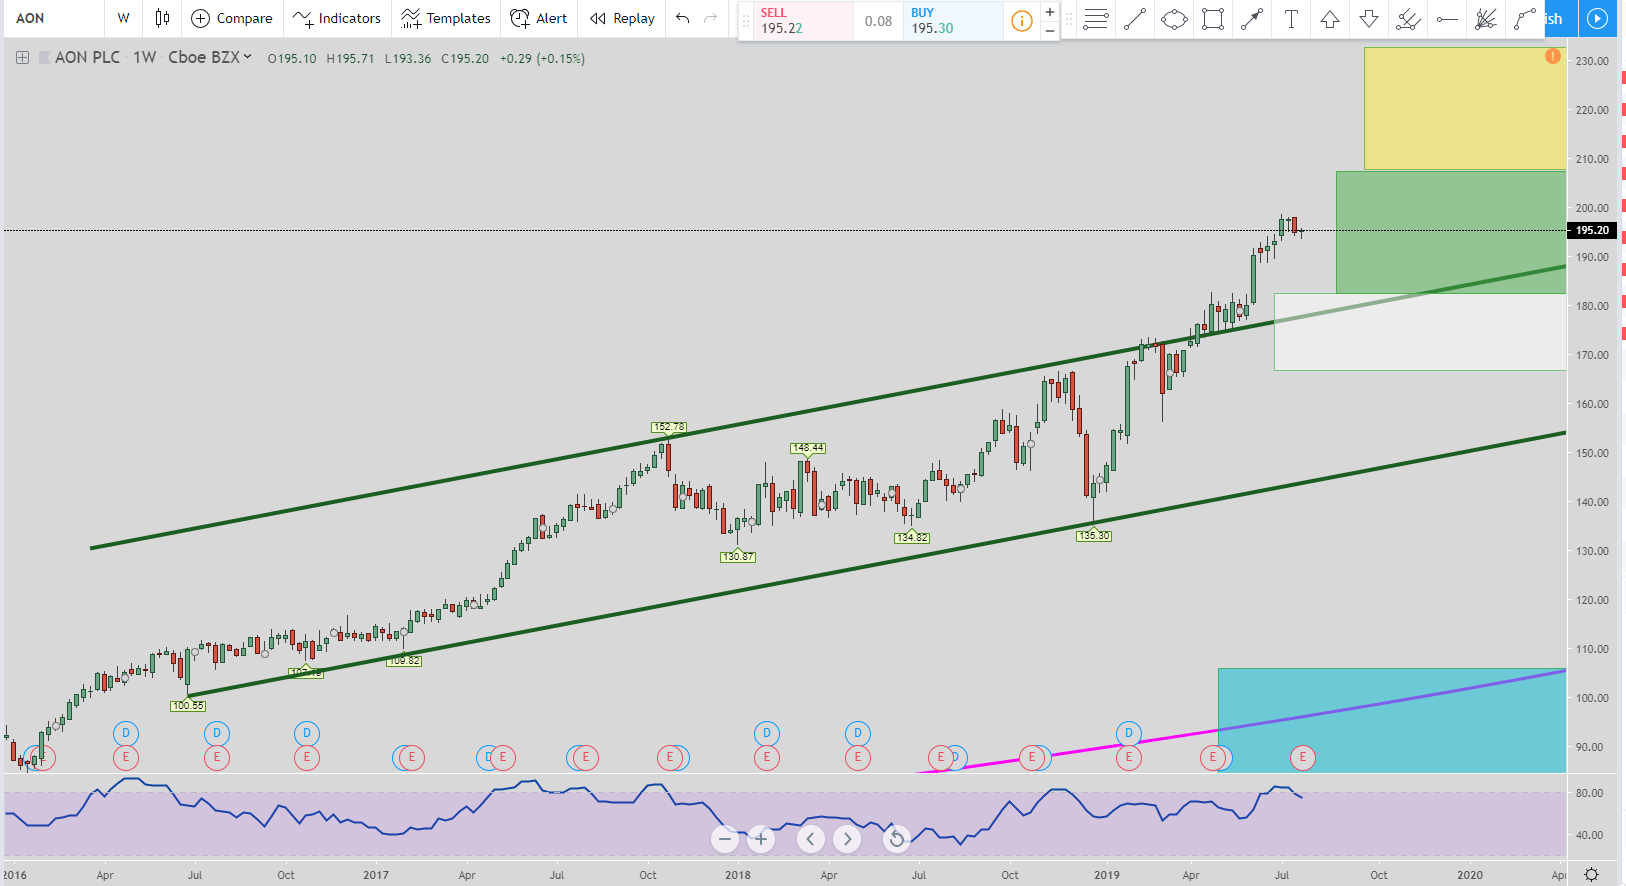
In the weekly chart we are in another 123-161 short setup. Right now the exit is the bottom of the white box around $167.15. But if the price moves up and hits the top of the green box before hitting the white box exit (the top of the green box is around $207) then the exit moves to the bottom of the green box which is around $183.
Finally, if the price continues to go up without hitting those exits and hits the top of the yellow box around $232.25 then the exits move to the bottom of the yellow box around $208.35. If the price continues to move up then you can continue to get in short wherever you want but the exit does not move again. If at anytime any of the exits are hit then you remove all resting limit short entry orders that are not filled because the move is over. It is then time to look for a new setup. This one is over.
I also wanted to show the trend lines that are in green. Notice how the price has recently broken above the top of the trend line. When this happens what we can usually expect is for the price to go down and break out of the bottom trend line the other side. Now this doesn’t mean the trend is over when it happens. But what I’ve noticed is when the price breaks out of the trend line to the upside in an uptrend then you can sooner than later expect the price to go down and break the trend line to the downside.
So with that explanation of the upside trend line break in an uptrend plus the stock being in the 123-161 short setup leads me to believe that some type of retracement will happen in the near future. Please be aware this is the weekly chart so this is in regards to the weekly time frame.
Monthly Chart
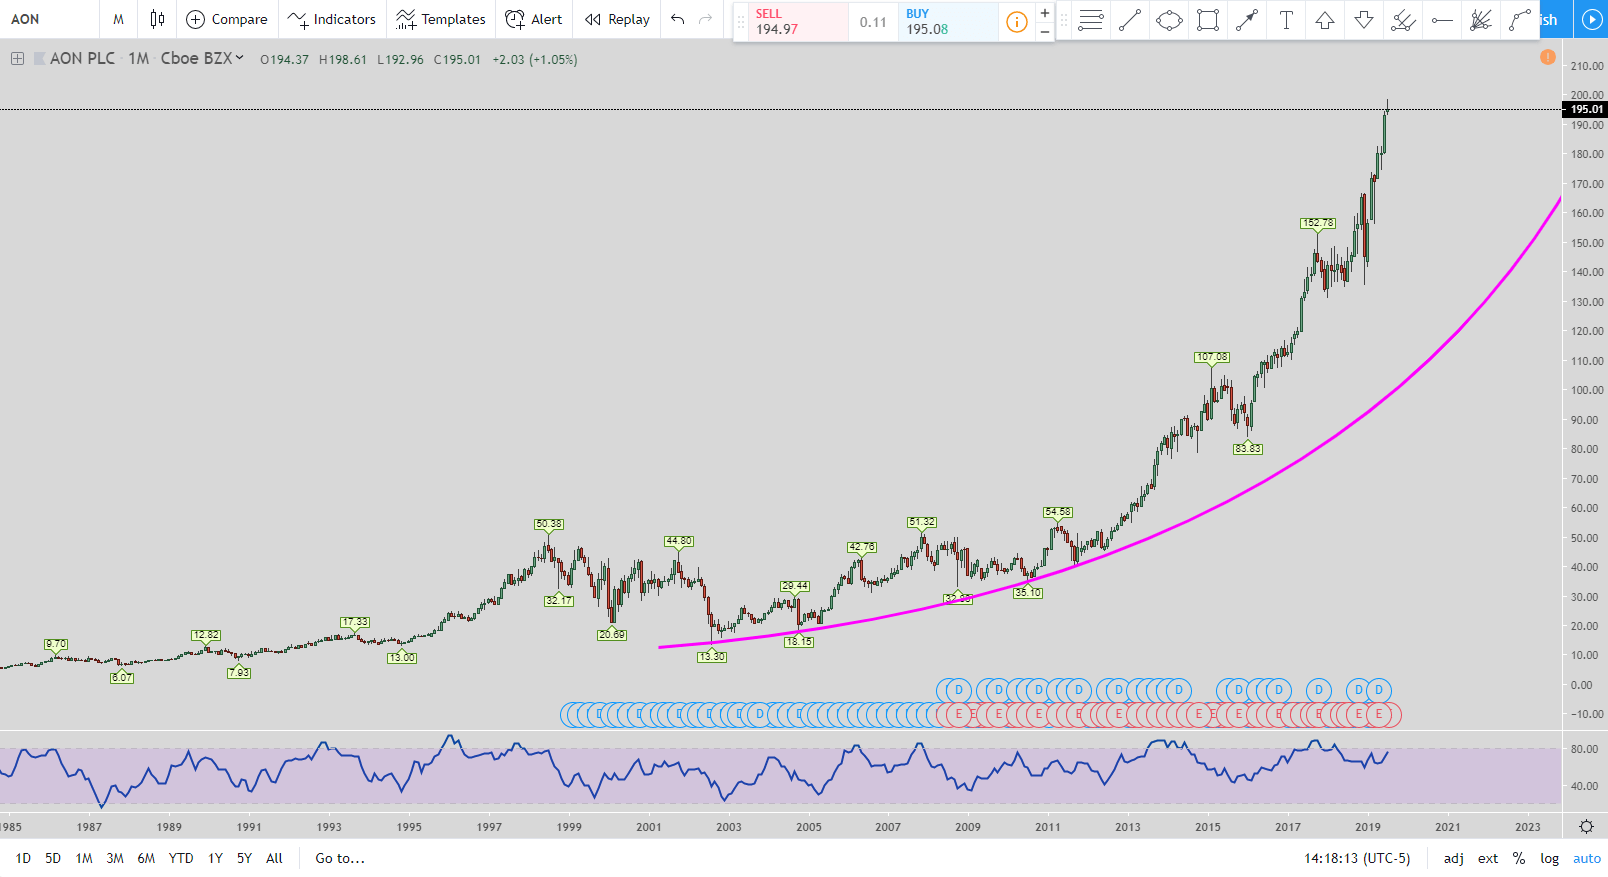
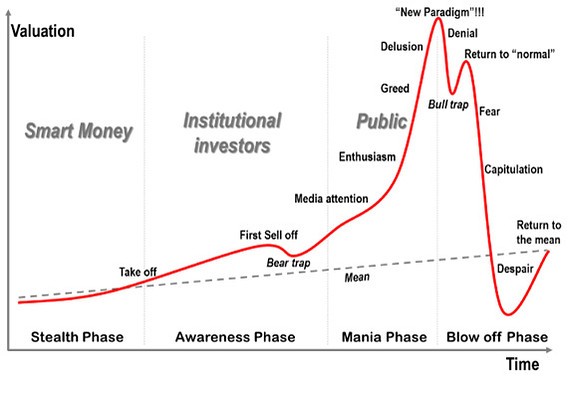
In the monthly chart I would like to point out that AON seems to be on a parabolic curve.
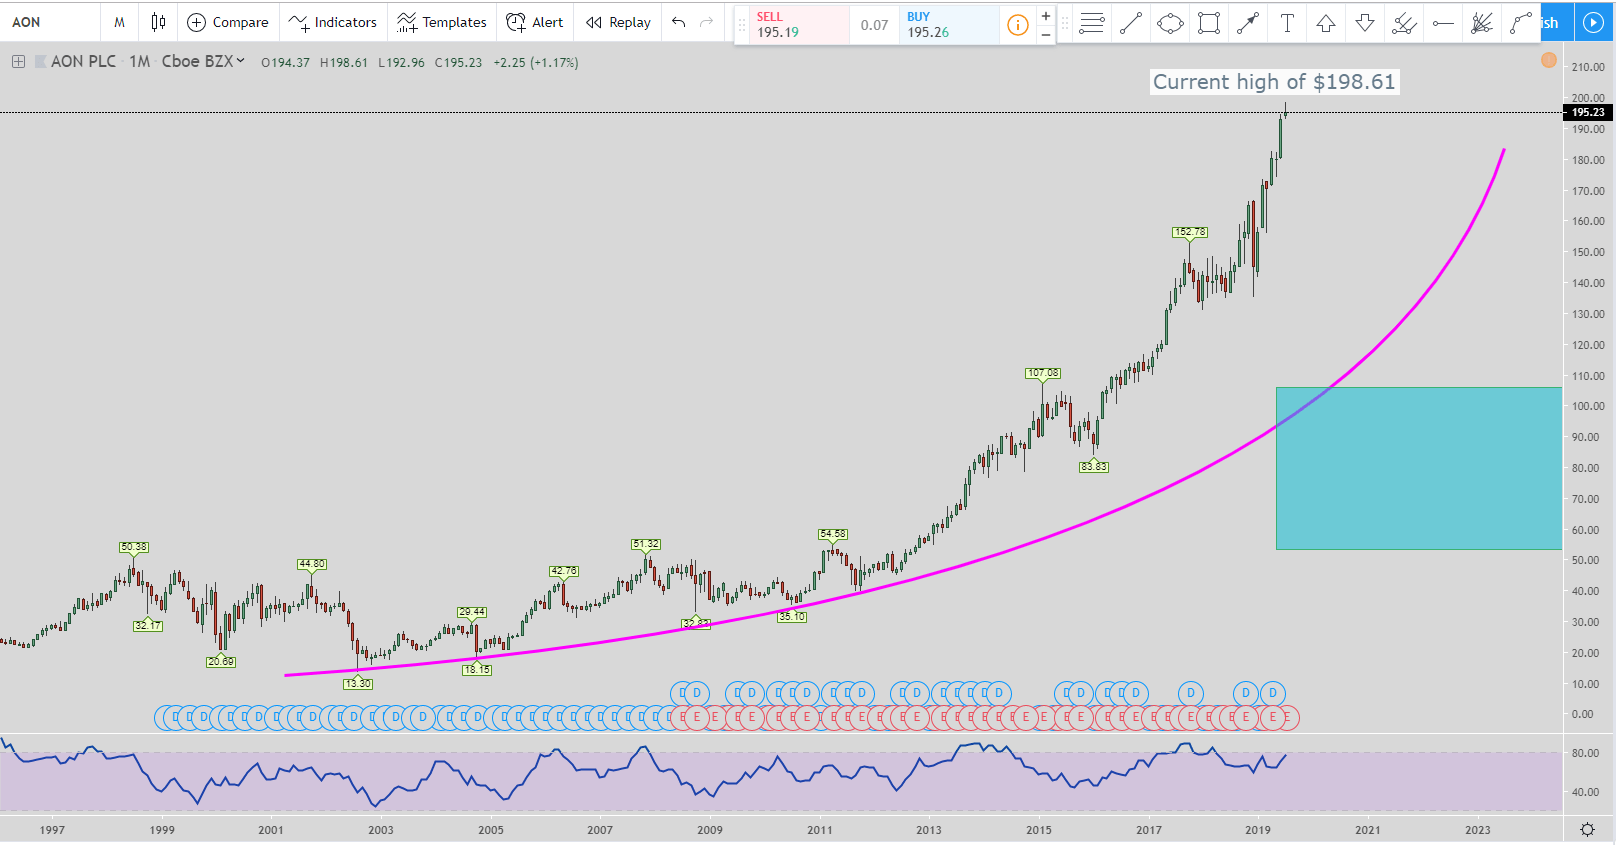
The teal box is the 50%-78.6% Fibonacci retracement. When a parabolic curve is broken then look for the 50% retracement to be hit. That would be around $106. This is of course if the current high of $198.61 holds. If the price continues to go up then the 50%-78.6% line will continue to move up as well.
Price can go as low as the 78.6% line after a parabolic curve break but it doesn’t happen every time. The 78.6% line is around $54 which is the bottom of the teal box. So the 50% line will be hit when the parabolic curve breaks. The 78.6% line can be a target but it doesn’t necessarily mean it will be hit after the break.
Here is another picture below of the emotions involved with a parabolic curve:
Conclusion and Forecast for the AON Stock Review for 2019
With AON on a long term uptrend the safe bet would be to not get in front of it. Eventually the stock will come back down but it could be years before that happens. If you are long AON then there really isn’t any reason to get out of the stock if you are in it as a long term investment. The one item to be aware of is the parabolic curve in the monthly chart. As I explained above, once it breaks then look for a 50% retracement.
But usually after it breaks it goes back up for a bit before the next big push to the 50% mark. So if the parabolic curve breaks but then there is a move up, that is when I would consider locking in any long term profits just to be safe. You can always let the rest ride if you have your initial investment taken care of.


