Today was the first full trading today after the oilfield attacks in Saudi Arabia. In the stock market today for 9-16-2019 we will go over how the S&P 500 moved and what we can look for tomorrow.
There wasn’t much to report on from the financial side. The only item of significance was the Empire State Manufacturing Index and that has a low impact no matter which way it reports.
But the big news as I mentioned last night was the impact that the attacks had on Saudi Arabia’s oil output. At the moment it looks like there won’t be a retaliatory attack today from the US and Saudi Arabia on the culprit who has been identified as Iran.
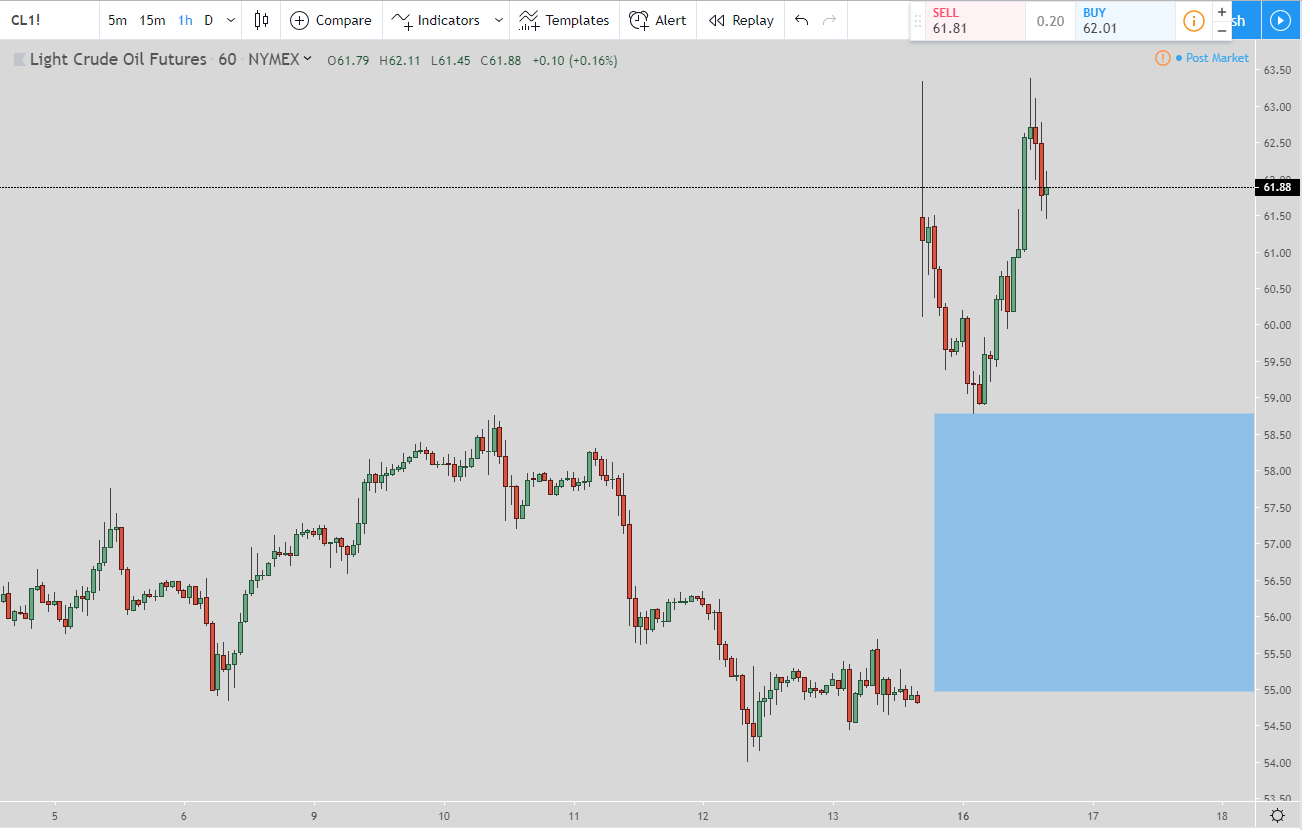
Oil prices will definitely go higher from here if attacks do happen in the short term. But in the long term once Saudi Aramco gets back up to full production we will see prices come back down. Especially to the previous gap of around $4 between $55 and $59, in order to get it filled.

U.S. oil production and exports have grown so much that U.S. supply is helping put a lid on the oil rally, following attacks that knocked out more than half of Saudi Arabia’s production.Analysts said if the outage is extended, more than several weeks, Brent crude could reach $75, and if there is a military response or more attacks, it could hit $85.
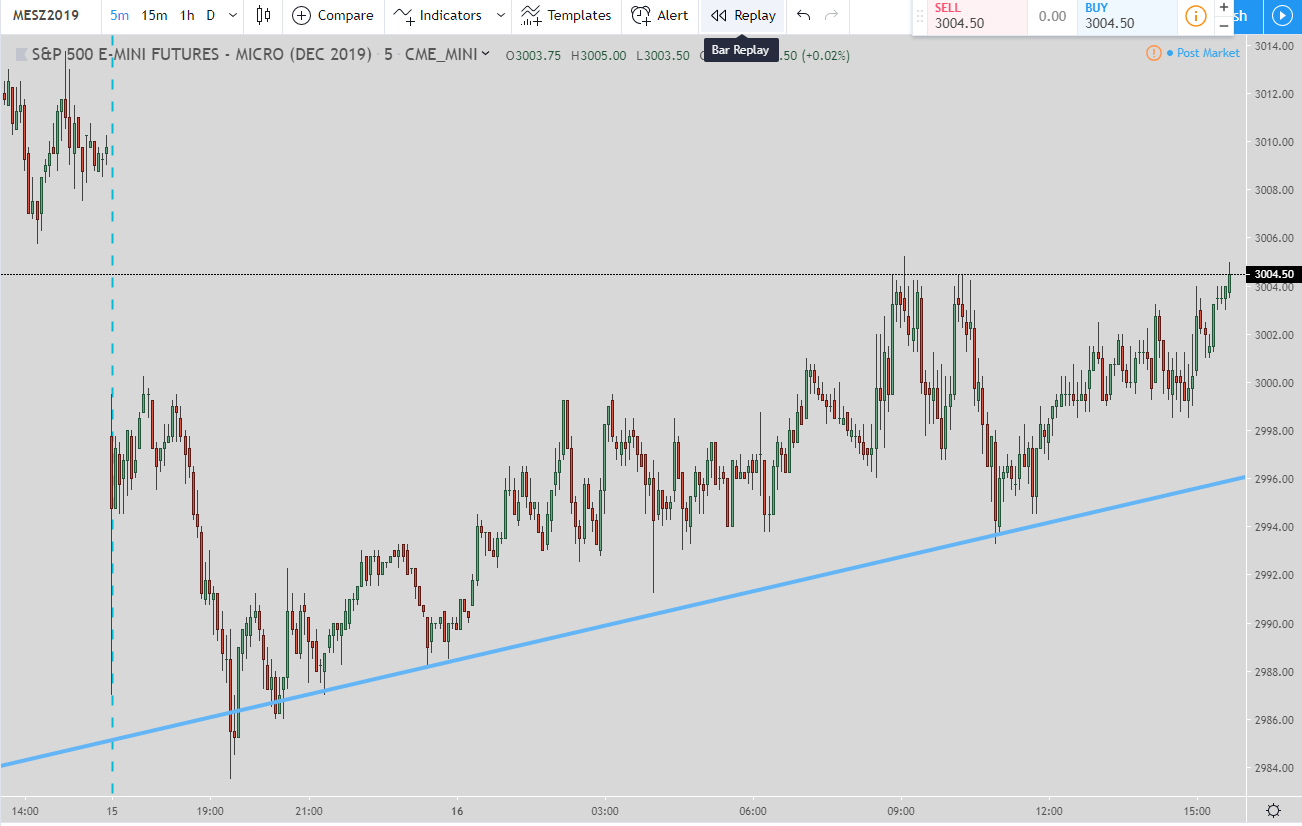
Today in the market the S&P 500 closed down slightly but is moving up in the after hours and is currently at 3,004.50. I was looking for the gap to get filled that it created last night which did end up happening.
S&P 500 Chart

In the 5-minute chart for the S&P 500 emini futures you can see how the gap was filled today. It also looks like in the session after the market closed that the price is continuing to move up to make sure that gap gets filled.
This was one point I mentioned in my email last night. Look for the gap to get filled before a move down. So far the gap has been filled so now I am on the lookout for a move down.
Crude Oil Chart

In the chart for crude oil I marked it up a bit. The blue box is the gap that goes from $54.89 to $58.78. I am looking for price to come back and get it filled.
I also put two trend lines on the chart. This will help guide us to the direction of the move in the very near future. If price breaks below the blue line then look for a move down.
But if the price breaks above the red line then look for more a move up. It looks like we will know very soon if there is more strength in this move or if we can expect a retracment.
Data for the Stock Market Today for 9-16-2019
If the data window does not load then CLICK HERE.
For the best news and analysis on stocks, futures, Forex, and cryptos then go to https://evancarthey.com for continuous coverage on ways to help you make money trading any market at any time.
If there are any other stocks, futures, Forex, or cryptos you would like to see added to the daily recap then please let me know and I will be glad to get them added. If you can trade it then I can analyze it.


