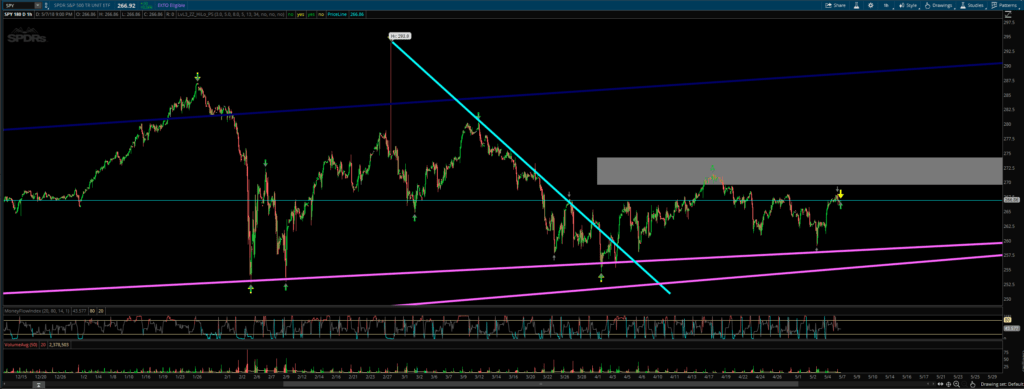
In looking at the one hour chart the SPY is currently a buy. Price is currently at $266.86. I have a target of $274.00. If there is any weakness to the SPY before $274.00 is hit then it is a buying opportunity.
1 Hour vs Daily Chart
Normally when I trade I look at the daily charts. For shorter term trades I have been looking closer at the 1 hour chart. One thing I am noticing with the daily charts is that the 38% Fib retracement level acts as a major support/resistance area. In the past I had moved my exits from the 50% fib retracement to the 38% for shorts: https://evancarthey.com/moving-the-short-exit-to-the-38-fibonacci-level-from-the-50-for-my-fib-extension-trade/.
For the 1 hour chart the 50% Fib retracement level seems to be the best exit level just like in almost everything else. From futures, forex, and the 1 hour stock charts the 50% Fib retracement level is king. For the daily stock charts I am beginning to think that the 38% Fib retracement level is king. I will need to do more testing to see if this holds true. The 50% does work but I’ve seen the 38% get hit numerous times and then a big move continuing in the major trend before the 50% was hit. It is something for me to look at much closer and re-evaluate like I am always doing with my trading style.
SPY 1 Hour Chart

Here you can see the top of the gray box is the 50% Fib retracement level. My exit would be just below the top of the gray box around $274.00. If price goes lower before hitting $274 then the long is still in play. Then you can get in at an even better price. Should price break the previous swing low at $254.59 before hitting $274 then I will need to adjust the exit down accordingly to how low price moves. Price broke the teal line but still has not hit the 50% retracement level so the long move is still in play. The magenta lines are support lines from moves on the daily chart. The dark blue line is a former support line that has now turn into resistance. The short term play is to the upside.
My NO Hedge Prediction
If I was making this trade I would be long and exit at $274.00. Should price goes lower before hitting $274 then the long is still in play. Then you can get in at an even better price. If price breaks the previous swing low at $254.59 before hitting $274 then I will need to adjust the exit down accordingly to how low price moves. But needless to say I predict the short term move is to the upside.
My Robinhood Referral
If this article helped you and you are thinking about signing up for Robinhood‘s trading service then please use my referral link so we each will receive a free share of a stock: http://share.robinhood.com/evanc203

