Technical Analysis of Silver
Silver has made a nice run up to around 15.675 in looking at the Daily chart. There are a couple of moves which can happen from this area so let’s look at each of them so we are covered.

We are using the pivot point from the high of June 13, 2018, and the low of August 16, 2018. As you can see price initiated the Lightning Trade setup on August 31, 2018. It never went down and hit the 127.2% Fibonacci Extension level. Since then it has gone up to hit the 38% Fibonacci Retracement level which brings the exit up to the 100% level at 14.325.
If I was looking at getting into silver I would wait to see what it is going to do. This goes for buying or selling silver. Right now my bias would be to the downside but this isn’t a place I like to get in a trade.
If price continues to go up to around 17.340 then shorting would be the play. Here is what the move with the exits would look like:
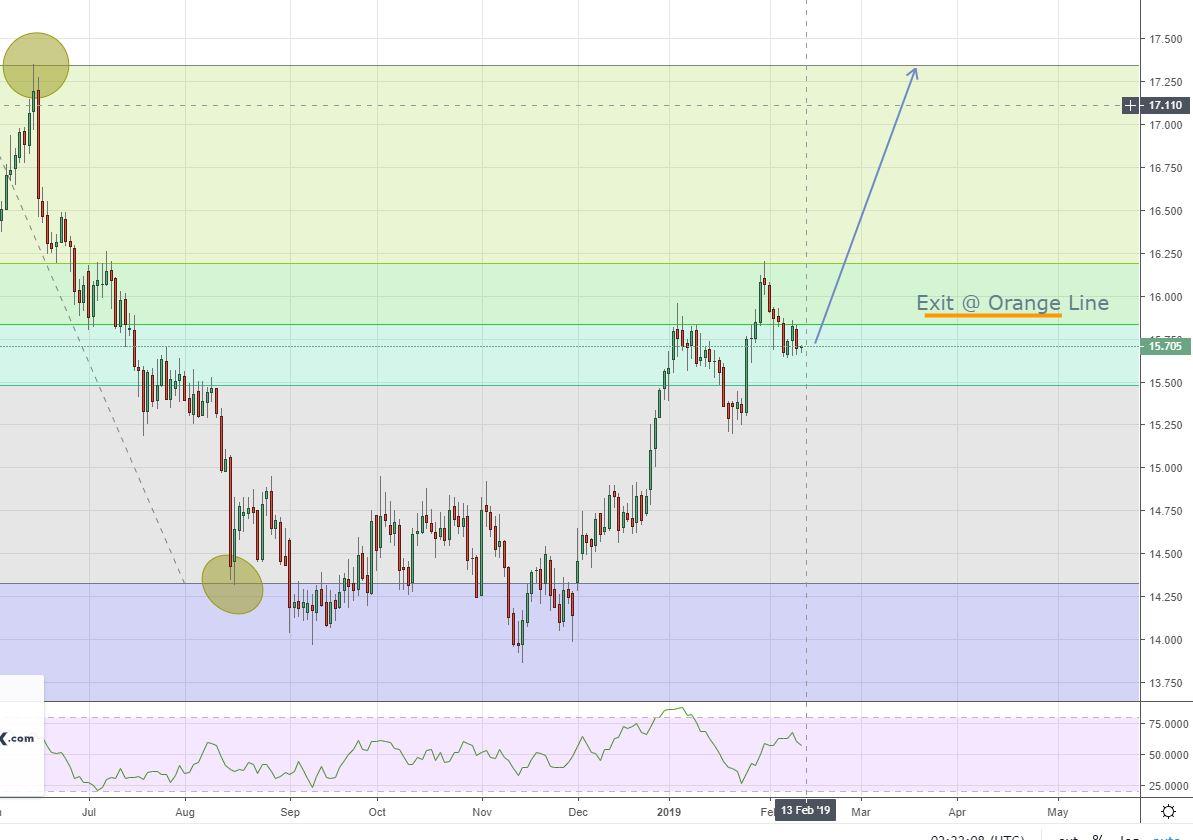
Right now price is in the middle of no-mans land. If I had to do one thing it would be to short it here with the target of 14.380. If price went up and hit 17.345 then the exit would move to 15.9.
This is why I am not big into getting into silver at the moment. If you get in now then you could have to take a small loss when you move your exit up if the price goes up and hits 17.345. Of course, if the price goes down first and hits 14.38 then the Lightning Trade setup is over and it is on to another trade setup.
In looking at the 1-hour time-frame I am much more bullish. From the picture below you can see how price initiated the Lightning Trade and then has gone back down to 15.680.
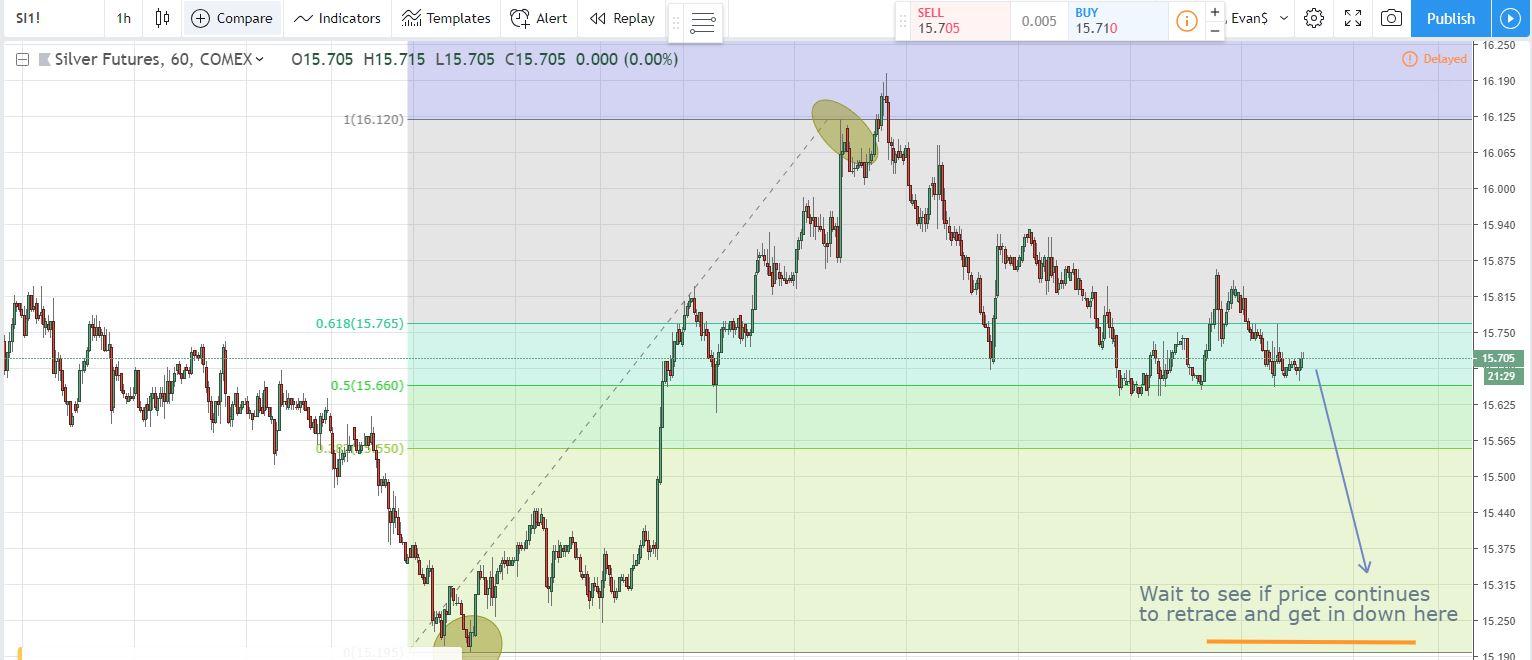
If I was to get in now then the exit would be at 16.100. But if price continued to move lower and hit 15.205 then I would move the exit to 15.640. I would also look to get in with another entry at 15.640.
So if I buy now and price continued to move against me then I would end up taking a little loss. On the flip side, I could miss a move up if the price does go up and hit 17.345. If silver does go up and hit 17.345 before going down and hitting 15.205 then the Lightning Trade setup is over and it is time to look for another trade.
The way I trade I always look for the setups where my final exit will always be in profit. That is why for where silver is on the 1-hour timeframe I wouldn’t be buying it right now. I would wait for a move lower (if that happens).
15-Minute Chart of Silver and the Video
In the video below I also add the 15-minute chart of Silver:
Conclusion of Silver
Hopefully, I laid out in clear detail on my gameplan for silver. In both the Daily and 1-hour time-frame chart Silver is in no-mans land. For the way I trade, I would hold off on purchasing it until it showed me a better setup to where it is in “free trade” territory.
I consider a “free trade” when the price is at a level that my exit will always be in profit no matter how much price goes against me. The final exit does not move lower. For that to happen with both of those trades I need Silver to move some more.
If this post benefits you and if you haven’t used Robinhood for trading stocks but are thinking to then please consider using my referral link when you do sign up: http://share.robinhood.com/evanc203.
This way each of us will receive a free share of a random stock if you sign up through my referral link.
My Robinhood Review: https://evancarthey.com/review-robinhood-trading-service-with-no-fees-part-1/