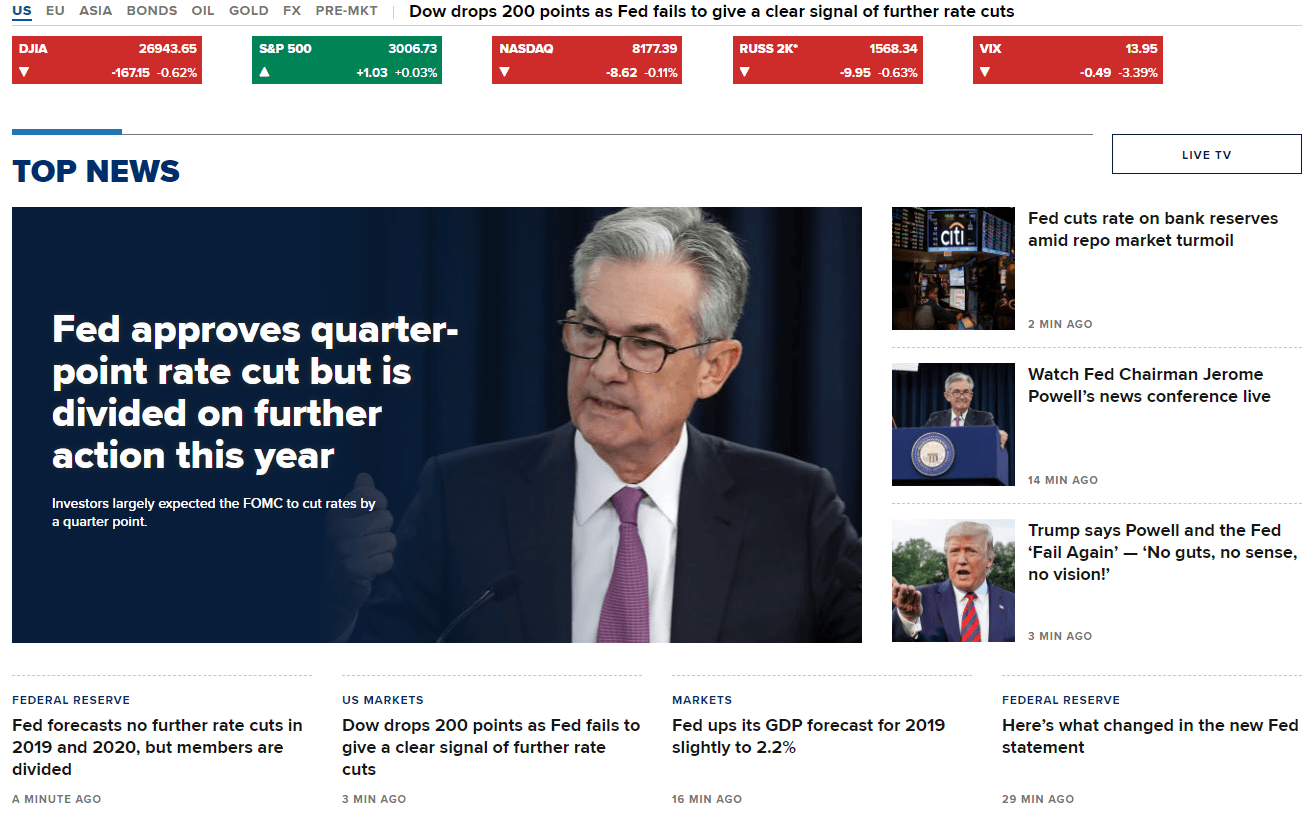
With the stock market today for 9-18-2019 the huge news was the Federal Reserve made the quarter point rate cut. This was the general conses that it was going to happen but you never know so the day’s trading is usually pretty slow up until the announcement.
After the announcement then the market goes crazy for a bit which is what you will see in the chart below. It impacts just about every market so it is always a fun day when there is an expected rate cut.
The big question now is will they make another rate cut this year? Going into next quarter when they are set to decide we could see even more movement since the market will really be guessing if they will cut or not. A lot of the time the market knows for the most part ahead of time.
The market hates uncertainty as I mentioned earlier this week and when there is no clear direction on what the Fed is going to do in the future then the market drops.
President Trump was not happy with the Federal Reserves decision.
The Dow Jones Industrial Average finished down today by 0.62% while the S&P 500 made a massive late day rally from the low at 2980.75 to a high of 3009.50. Finishing the day’s trading session at 3006.75.

S&P 500 Chart with the Stock Market Today for 9-18-2019

Here you can see how the S&P 500 had the late surge in the day to finish slightly positive for the day. Leading up to the Fed’s announcement you can also see how boring of a trading day it is for day traders.
But look at the huge movements just before and after the announcement! It will be interesting to see if that move up holds or if we see some retracement of it tomorrow.
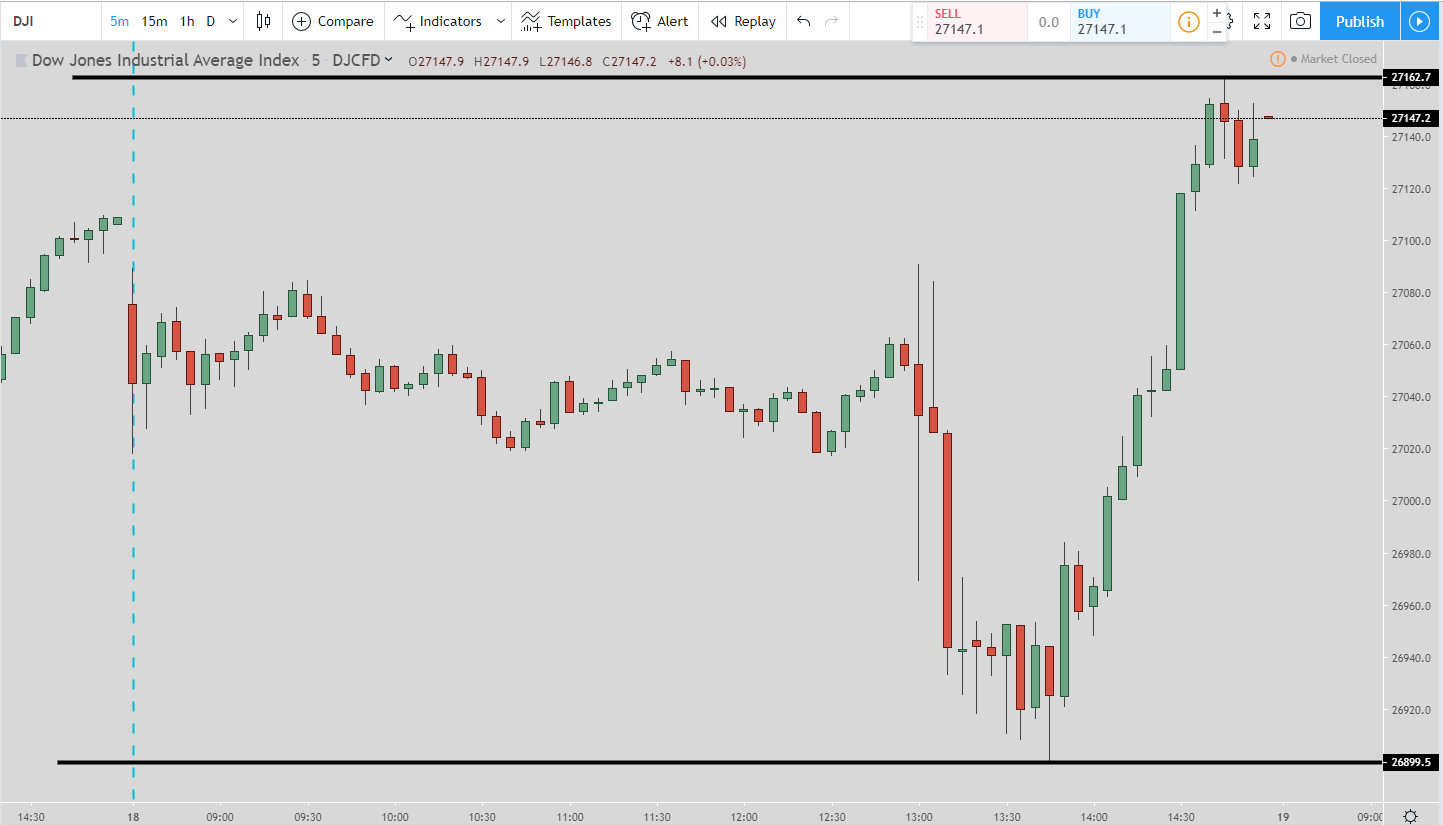
Dow Jones Industrial Average Chart

Pretty much the same pattern for the DJI as the S&P 500 chart. A super slow day until the Fed’s announcement and then the fireworks. For all of these charts I am using a 5-minute time frame.
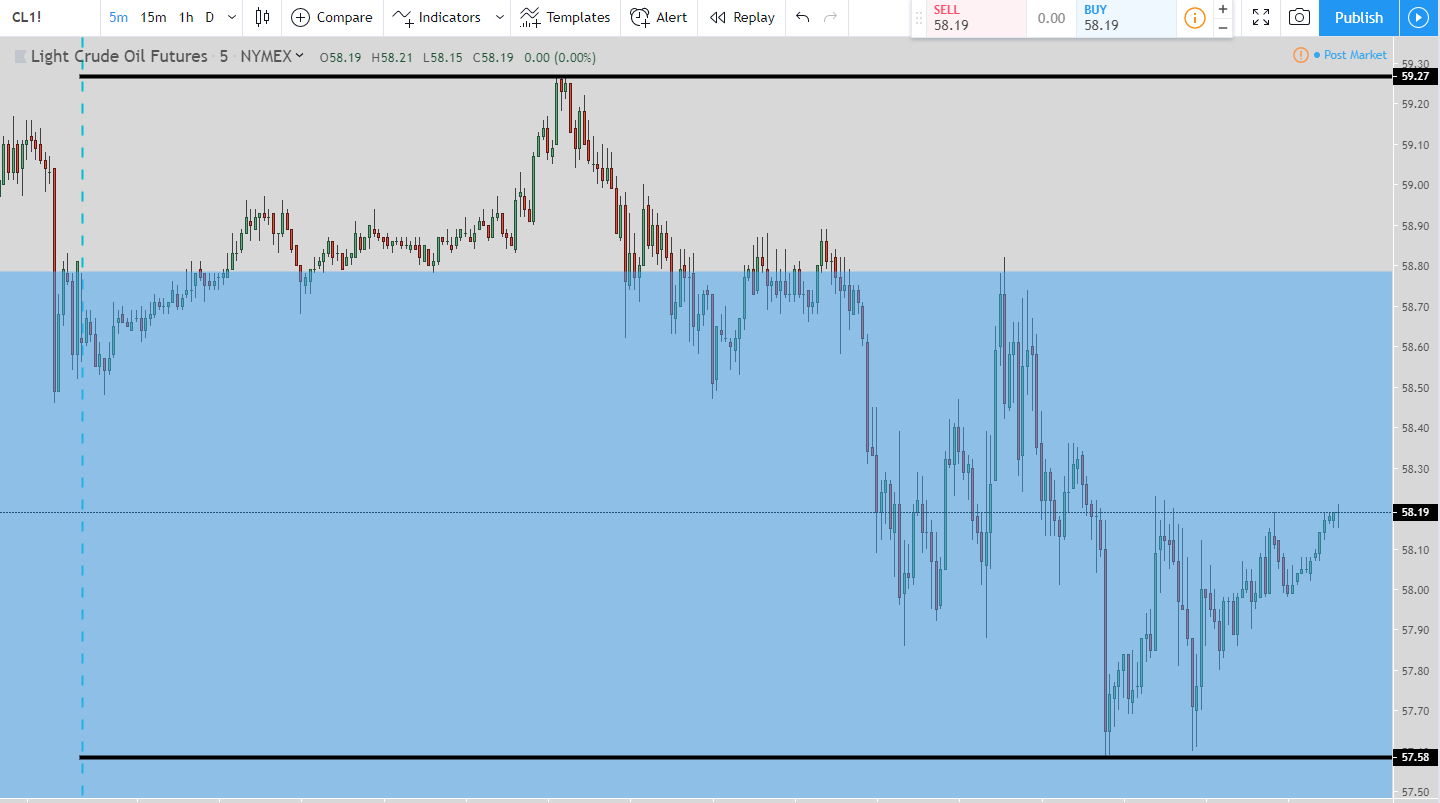
Crude Oil Chart

With Crude Oil you can see the downtrend is underway for the huge gap up from the Saudi oilfield attacks to come back and get filled.
The blue box is the gap where you can see price is firmly entrenched with. The bottom of the gap (the blue box) is around $54.90. So with the current price of $58.19 there is still some more room to the downside.
Video
Data for the Stock Market Today for 9-18-2019
If the data window does not load then CLICK HERE.
For the best news and analysis on stocks, futures, Forex, and cryptos then go to https://evancarthey.com for continuous coverage on ways to help you make money trading any market at any time.
If there are any other stocks, futures, Forex, or cryptos you would like to see added to the daily recap then please let me know and I will be glad to get them added. If you can trade it then I can analyze it.


