Since late December 2018, the Nasdaq (NQ) has been going almost straight up. From 5820 to 7879. This past week there has been a little pullback but Friday ended with a big bullish hammer candle so there are signs of bulls in the area. This post will be how to trade the Nasdaq (NQ) for the week of 5-13-19.
We will look at the daily chart, the 1-hour chart, and the 15-minute chart to see what long or short setups are available based upon my setups.
")
Nasdaq Daily LongFrom this daily chart, the setup we are waiting on is the 127 long. When price retraces to the 0% Fibonacci level that will initiate the trade at 6965.75.
Once it does that then the exit is the pink line at 7266. I put the two other entry levels on there as well. But these levels are only used if an exit is not hit. If the price goes up and hits 7266 then the other entries are invalid and the move is over. So if the price continues to retrace and hits 6526.50 then that is the 2nd entry with the exit moving to the pink line at 6954.75. Lastly, if the price goes all the way down to 5817.75 then the exit moves to the bottom pink line at 6373.
If price continues to move lower without hitting an exit then you can keep on going long. The exit does not move from 6373 but you can get out anytime you wish.
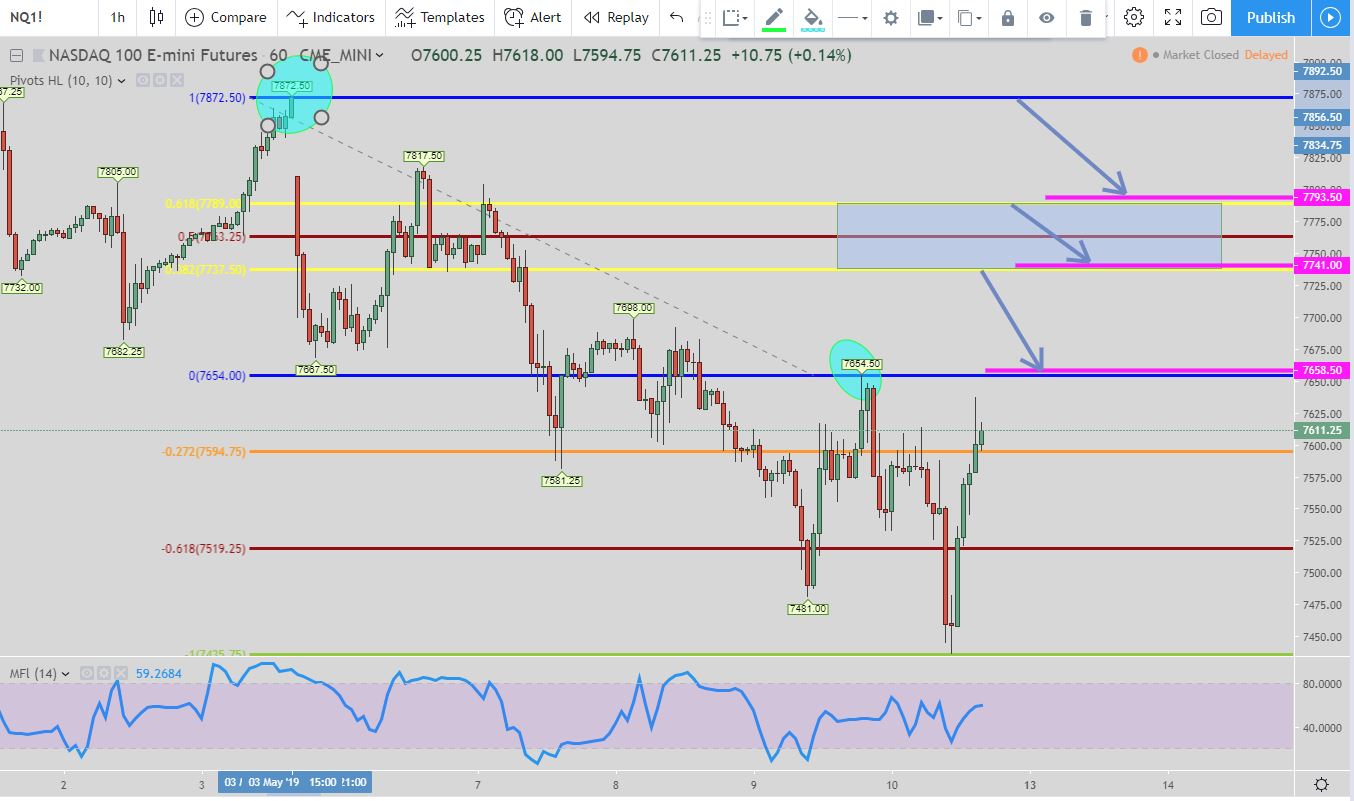
In the hourly chart, we are waiting for a short setup. The setup being used is the 61B short setup.
The initial entry will be when the price hits the 38% Fibonacci retracement level at 7737.50. From there the exit will be 7658.50. But if the price continues to retraces and hits the 68% at 7789 then that would be the 2nd entry.
The exit would then move to 7741. Finally, if the price continues to go up without hitting either of those exits and reaches 7872.50 then that would be the 3rd entry and the exit would move to 7793.50. This would be the last time you would move the exit even if the price continues to go up.
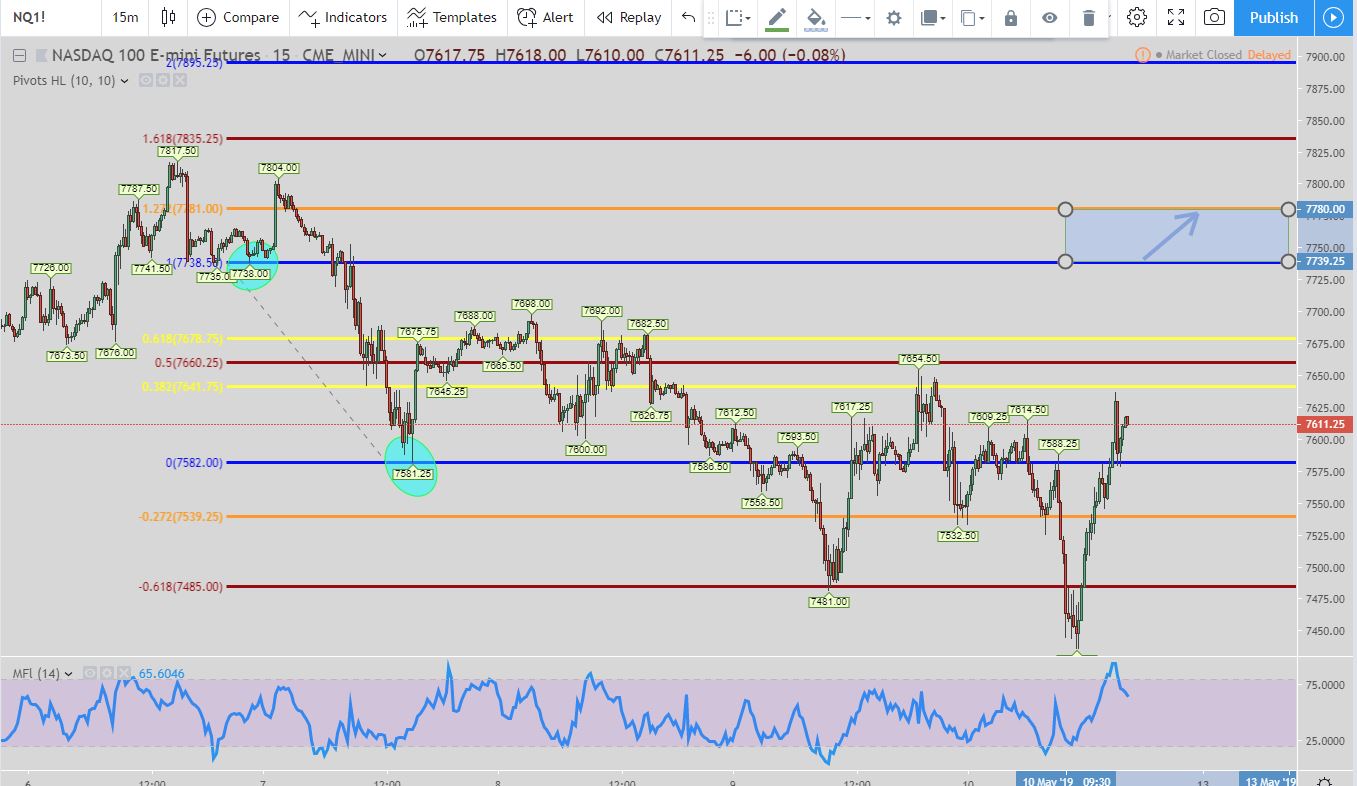
For the 15-minute chart, I like a breakout long setup that has formed. It isn’t live yet. What I am waiting on is the price to break into the blue box at 7739.25. Once it does then the exit is the top of the blue box at 7780.
Conclusion for How to Trade the Nasdaq (NQ) for the Week of 5-13-19
For the daily chart, we are waiting on the Nasdaq to retrace in order to provide a long setup.
On the hourly chart, a short looks like it is the next set up in the cards.
In the 15-minute chart, I am waiting on a breakout trade. So there are different setups on each time frame which tells me there should be good movement next week in the Nasdaq.
Popular Links
Here are a couple of links if you are looking at how I view the market and some trade setups. You can create your own trading style and setups. Quit paying losing traders to teach you. The only thing they teach is how to lose money.
Robinhood Trading Broker
If this post benefits you and if you haven’t used Robinhood for trading stocks but are thinking to then please consider using my referral link when you do sign up: http://share.robinhood.com/evanc203.
This way each of us will receive a free share of a random stock if you sign up through my referral link.
My Robinhood Review: https://evancarthey.com/review-robinhood-trading-service-with-no-fees-part-1/

