This week saw the market go down pretty much the whole week until Friday of 5/10/2019. Then a hammer formed and support came in. This will be the S&P 500 review for 5/10/2019. I will go over the daily, hourly, and 15-minute chart to see what setups are forming and what to look for.

For this S&P 500 review for 5/10/2019 let’s start off looking at the daily chart and work our way down the time frames.

What we are waiting on in this setup which I call the 127 long is for the price to come down and hit the 0% Fibonacci line which is the blue line. Once it does then the setup will be initiated and the exit to look for will be 2837.75. But if price continues to go down and hits the 38% line at 2570.25 then the exits will move to the top blue line at 2760.50. Lastly, if the price continues to decline without hitting the exit and hits the bottom blue line at 2317.25 then the exits move to just below the 50% Fibonacci line (the red line) at 2515.50.
After that, the exit does not move even if the price continues to move lower.

This is a long 61B setup. when the price came down and hit the 38% Fibonacci line (the yellow line) then it initiated this trade. The exit is at 2898.75. With price currently at 2887.75 it will probably be complete early next week.
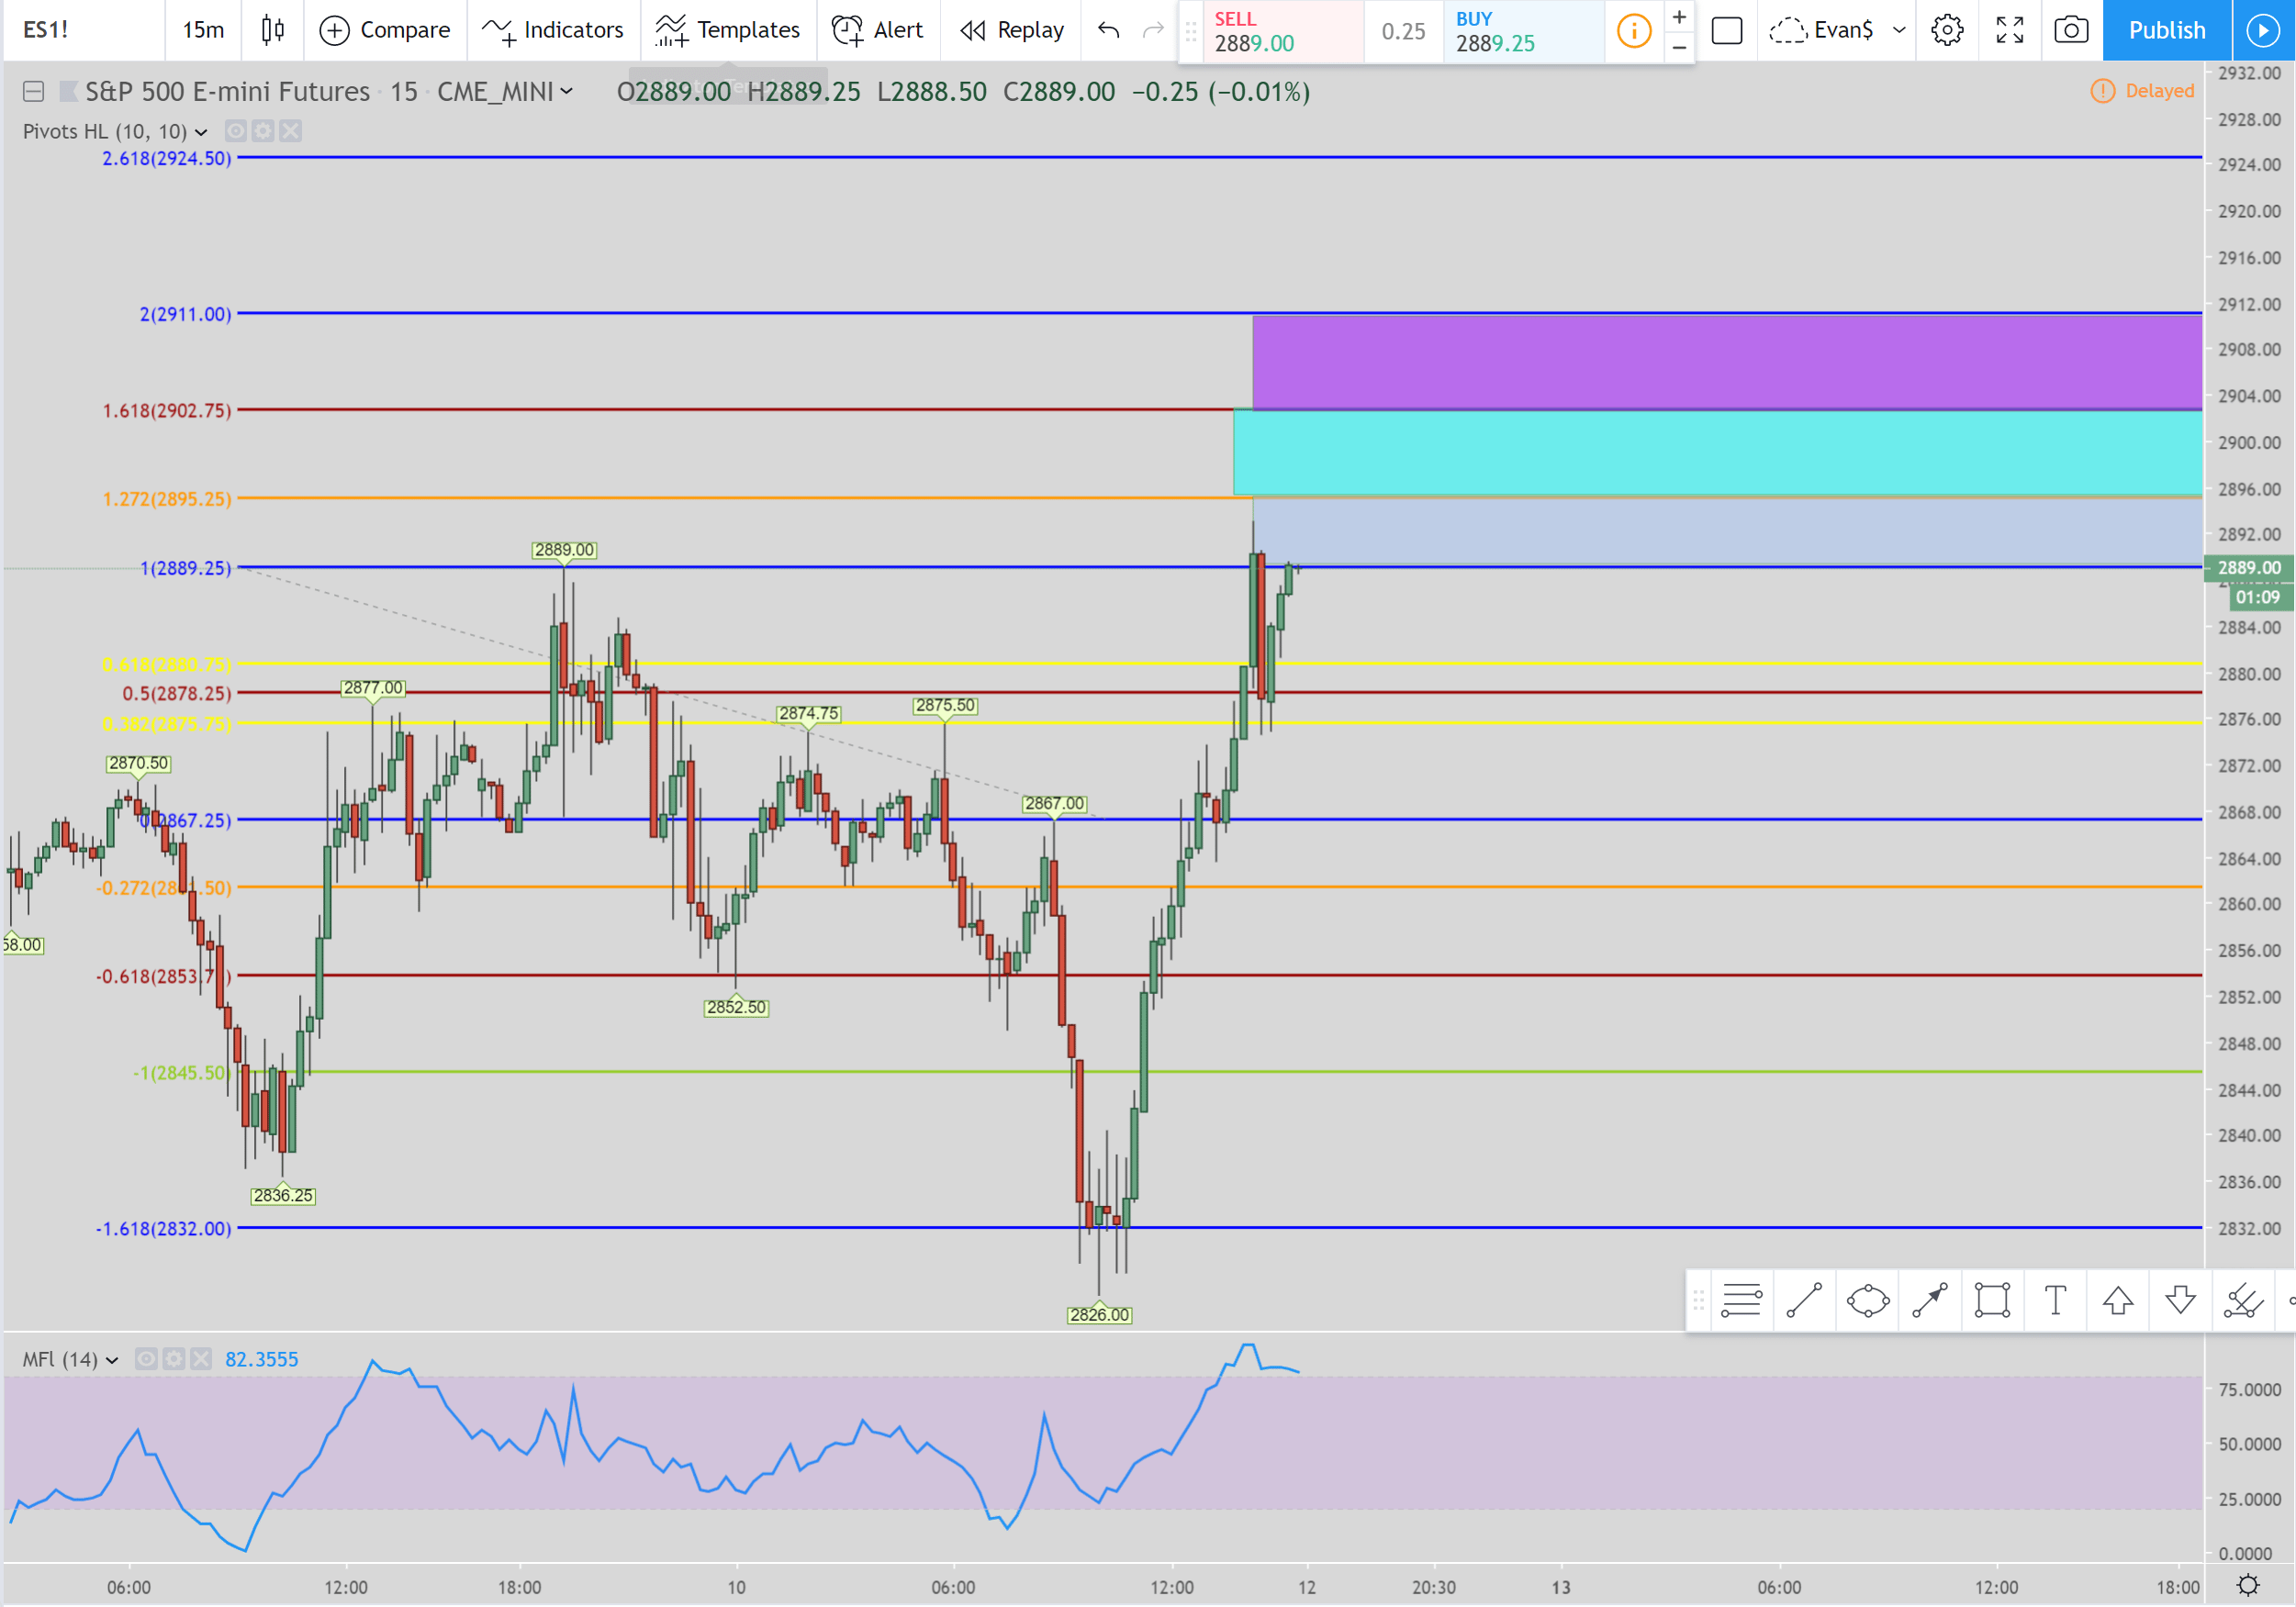
There is a shortcoming up in the 15-minute chart. I color coded the zones to make it easy to see. When the price hits the top of the blue zone at 2895.25 then the exit will be at the bottom of the blue zone at 2889.25. But if the price continues to go up and hit the top of the teal zone at 2902.75 then the exit moves to the bottom of the teal zone at 2895.25.
Finally, if the price goes up and hits the blue line at 2911 then the exit moves to the bottom of the purple box at 2902.75. Even if the price continues to go up (even passed the top of the purple box then the exit does not move again. It stays at the bottom of the purple box. That is the final move of the exit.
Wrapping Up the S&P 500 review for 5/10/2019
Hopefully, this S&P 500 review for 5/10/2019 will help with some direction of what to expect next week. It looks like we have some longs to complete in the daily and 1-hour chart in order to see if more downside is on the horizon. If the US and China get things more positive for their talks then we could see the market spring back up.
But if the news continues to drag on between the US and China then some more downside could be on the horizon. There will still be some resistance as shorts get initiated if the S&P 500 continues to move up. So we could be in for some really nice action if you are a day trader next week.
Popular Links
Here are a couple of links if you are looking at how I view the market and some trade setups. You can create your own trading style and setups. Quit paying losing traders to teach you. The only thing they teach is how to lose money.
Robinhood Trading Broker
If this post benefits you and if you haven’t used Robinhood for trading stocks but are thinking to then please consider using my referral link when you do sign up: http://share.robinhood.com/evanc203.
This way each of us will receive a free share of a random stock if you sign up through my referral link.
My Robinhood Review: https://evancarthey.com/review-robinhood-trading-service-with-no-fees-part-1/

