Abbot Laboratories (ABT) is the stock I am reviewing today to see if you should buy or sell. I will look at the fundamental markers I use to see if a stock is a growth stock. Then I will look at the charts using the trading setups I use to see if there are any trades taking place and what could be in store for the stock.
Buy or Sell Abbot Laboratories (ABT) Stock
There are 7 fundamental markers I look for in a stock. I try to only purchase growth stocks so these are the parameters I look for to see if a stock meets the majority of the markers. I prefer to have all seven fulfilled. You can it more in depth here: https://evancarthey.com/how-to-scan-for-winning-stocks-an-insiders-view-to-my-process/
- Market Cap: > $300 million
- EPS growth past 5 years: >0%
- P/E: Over 10
- EPS growth next 5 years: >0%
- Sales growth past 5 years: Over 20%
- Debt/Equity: <0.1
- Sales growth qtr over qtr: Over 5%
Does Abbot Laboratories meet these 7 markers?
- Market Cap: 136.36B (YES)
- EPS growth past 5 years: 2.00% (YES)
- P/E: 56.04 YES
- EPS growth next 5 years: 10.74% (YES)
- Sales growth past 5 years: 9.20% (NO)
- Debt/Equity: 0.64 (NO)
- Sales growth qtr over qtr: 2.30% (NO)
I used Finviz.com for the fundamental analysis screener. With ABT only hitting 4 out of the 7 markers I cannot pass this off as a growth stock. That doesn’t necessarily mean the fundamentals are bad. It just shows me that ABT should not be considered a potential candidate for being labeled as a growth stock.
Technical Analysis for Abbot Laboratories (ABT)

To be honest there are not really any buy setups Abbot Laboratories is currently in. Price has been in an uptrend since December 2016 so if you have purchased that stock just about anywhere in that time then you are in profit.
The only setup to wait for is the 38-127 trade. If the current pivot high of $80.74 holds then the trade will execute if price retraces to $74.95. The 1st exit would be at the 127.2% Fibonacci Extension area of $84.91. Otherwise we are in wait and see mode.
You’ll notice how the MFI has started to retrace from the overbought territory so it could mean price is taking a breather from the run up and catching its breath.
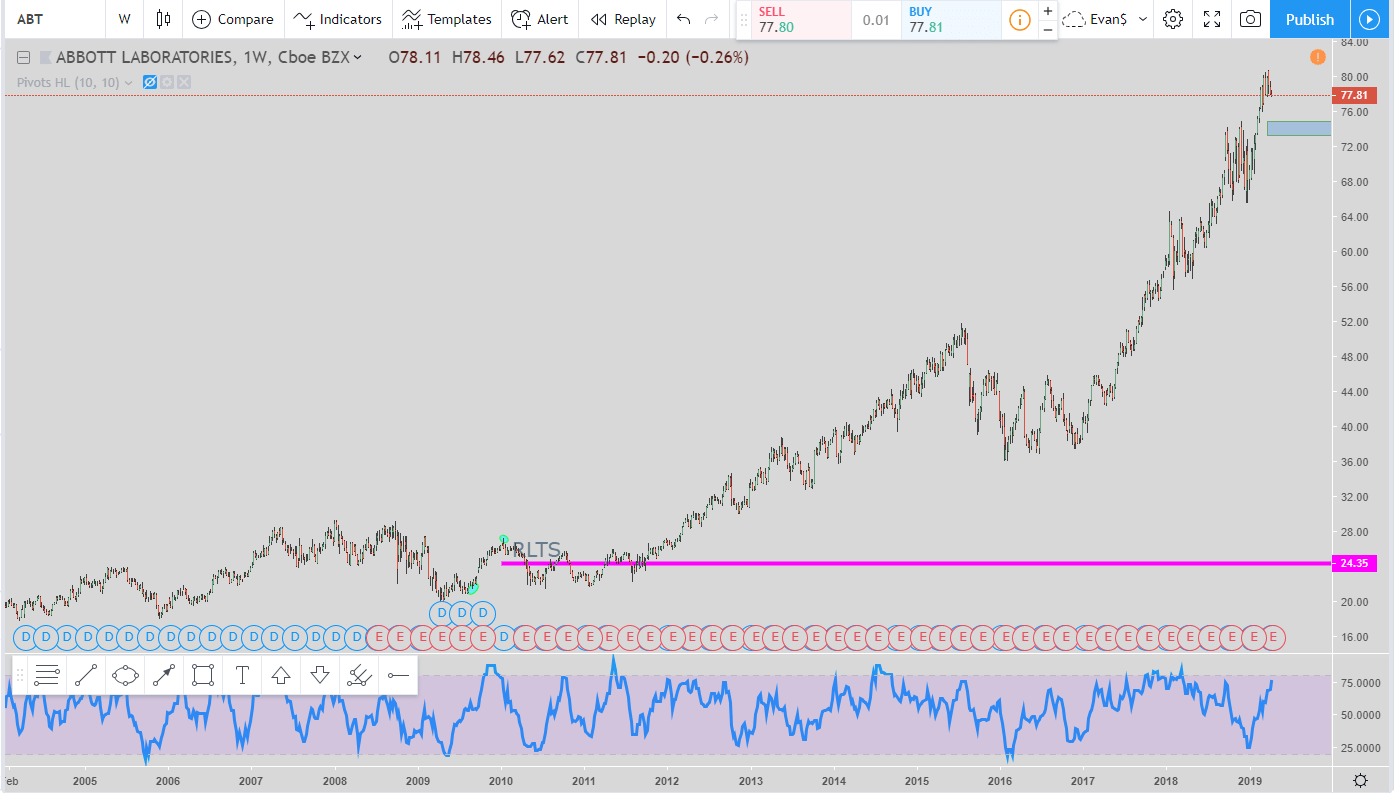
There is one item to be concerned about. In retracing the stocks run up I found one Reverse Lightning Trade setup to the short side that was never completed. So what that means is one day price will retrace and fill the exit.
I labeled the exit with the pink line. It is at $24.35. Now this doesn’t mean price will go down there tomorrow, it just means that one day price will retrace back to this level. But overall from the chart you can see that Abbot laboratories (ABT) has been in an amazing uptrend going on almost 10 years now.
Popular Links
Here are a couple of links if you are looking at how I view the market and some trade setups. You can create your own trading style and setups. Quit paying losing traders to teach you. The only thing they teach is how to lose money.
My Robinhood Shameless Plug
If this post benefits you and if you haven’t used Robinhood for trading stocks but are thinking to then please consider using my referral link when you do sign up: http://share.robinhood.com/evanc203.
This way each of us will receive a free share of a random stock if you sign up through my referral link.
My Robinhood Review: https://evancarthey.com/review-robinhood-trading-service-with-no-fees-part-1/
