The Downward Spiral
Since peaking around $18,723 on 12/18 the price of Bitcoin has seen a retracement of around 50% in a massive downward move that was felt today. How much further will Bitcoin move downward? In this post I mentioned what I felt would happen next as far as whether Bitcoin would move up or down: https://evancarthey.com/bitcoin-nyxbt-analysis-12-30-17/
I was off in that post due to not using the correct pivot points due to not using the correct exit short fib retracement levels. Now I believe I hit the high very nicely after “discovering” where to get out of shorts: https://evancarthey.com/moving-the-short-exit-to-the-38-fibonacci-level-from-the-50-for-my-fib-extension-trade/
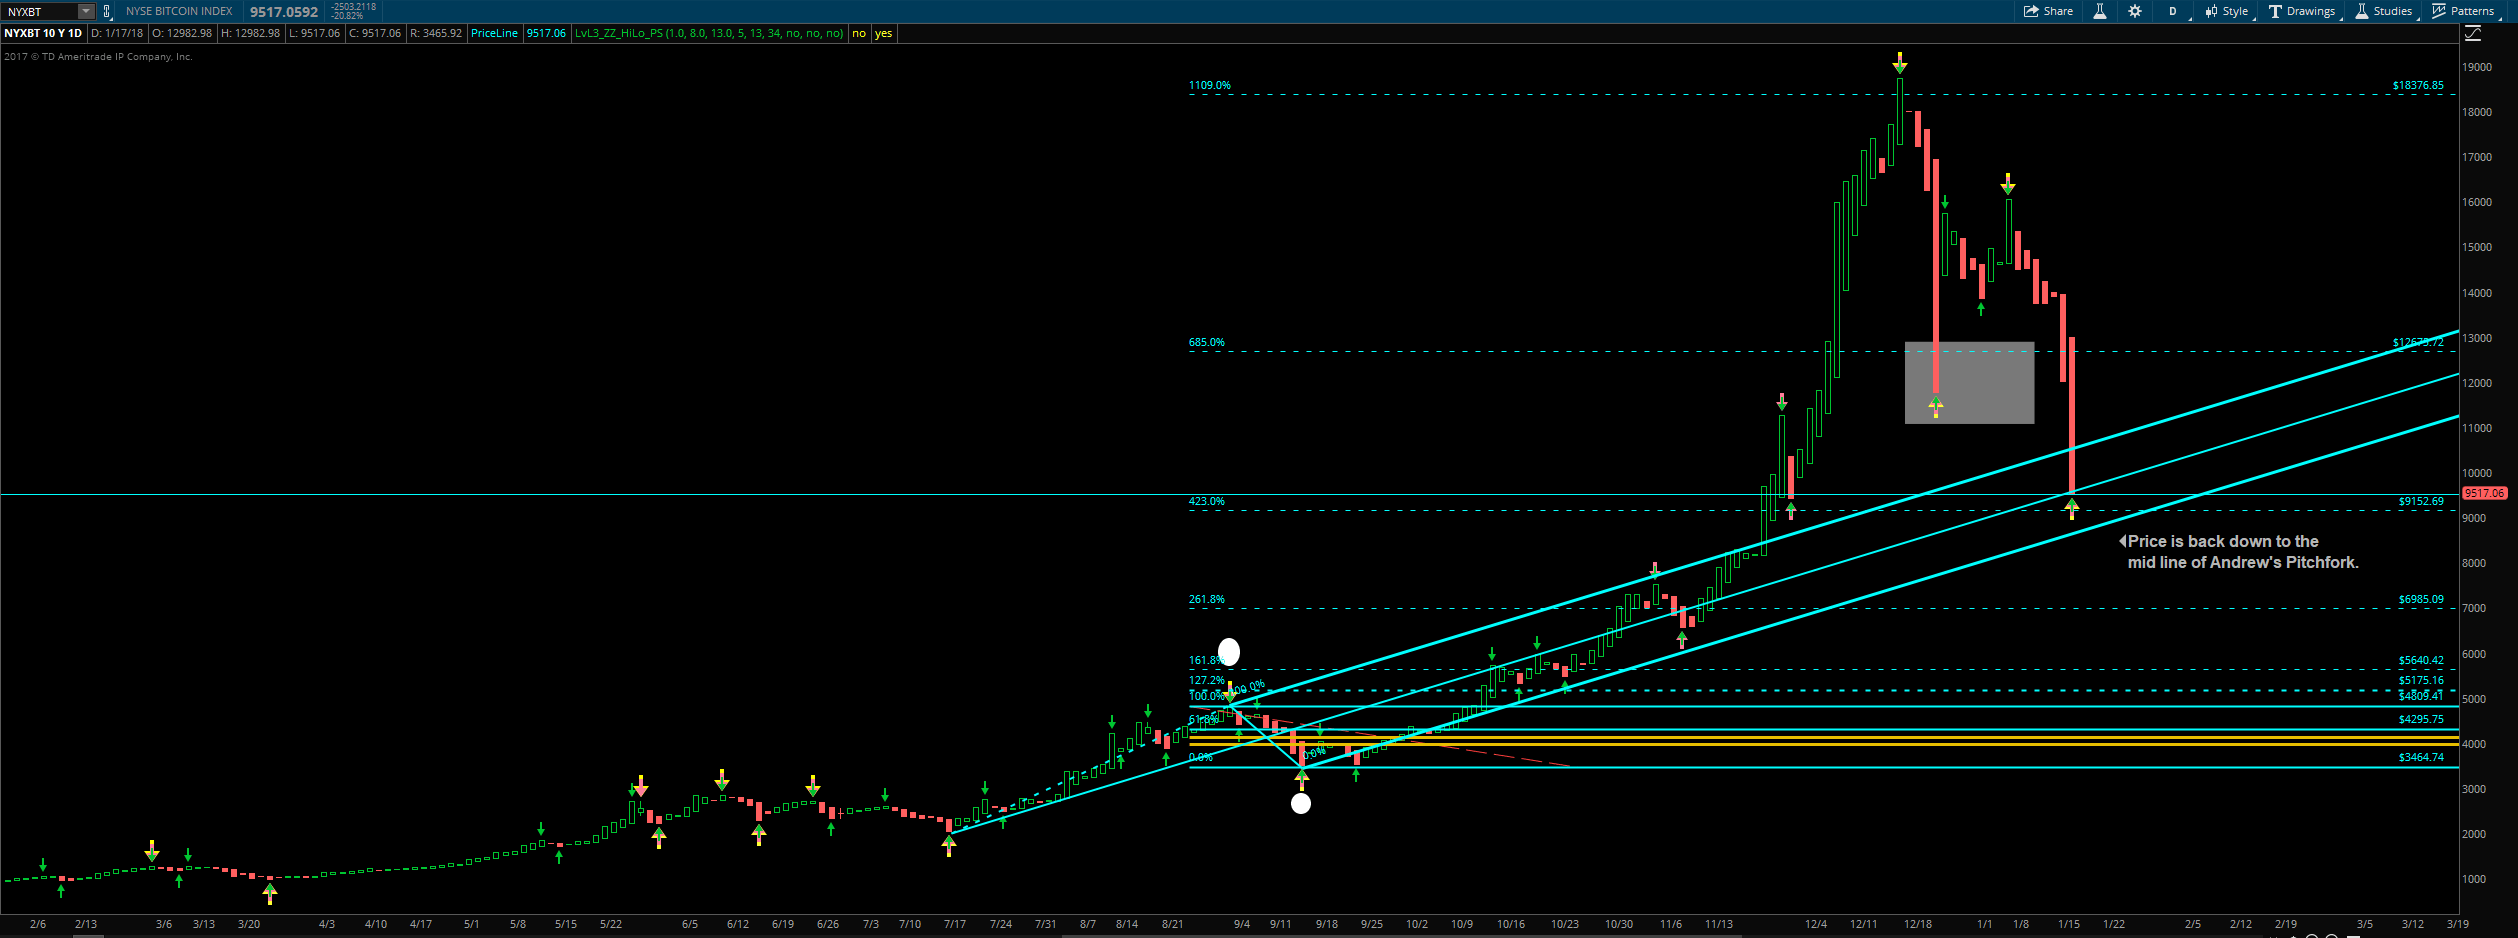
Here you can see how price hit off the 1109% fib extension and it has been down every since. Price has now retraced back to the mid-line of Andrew’s Pitchfork and well below the 38% fib retracement which was reached during the 1st leg down a week or two ago.
Where to Next?
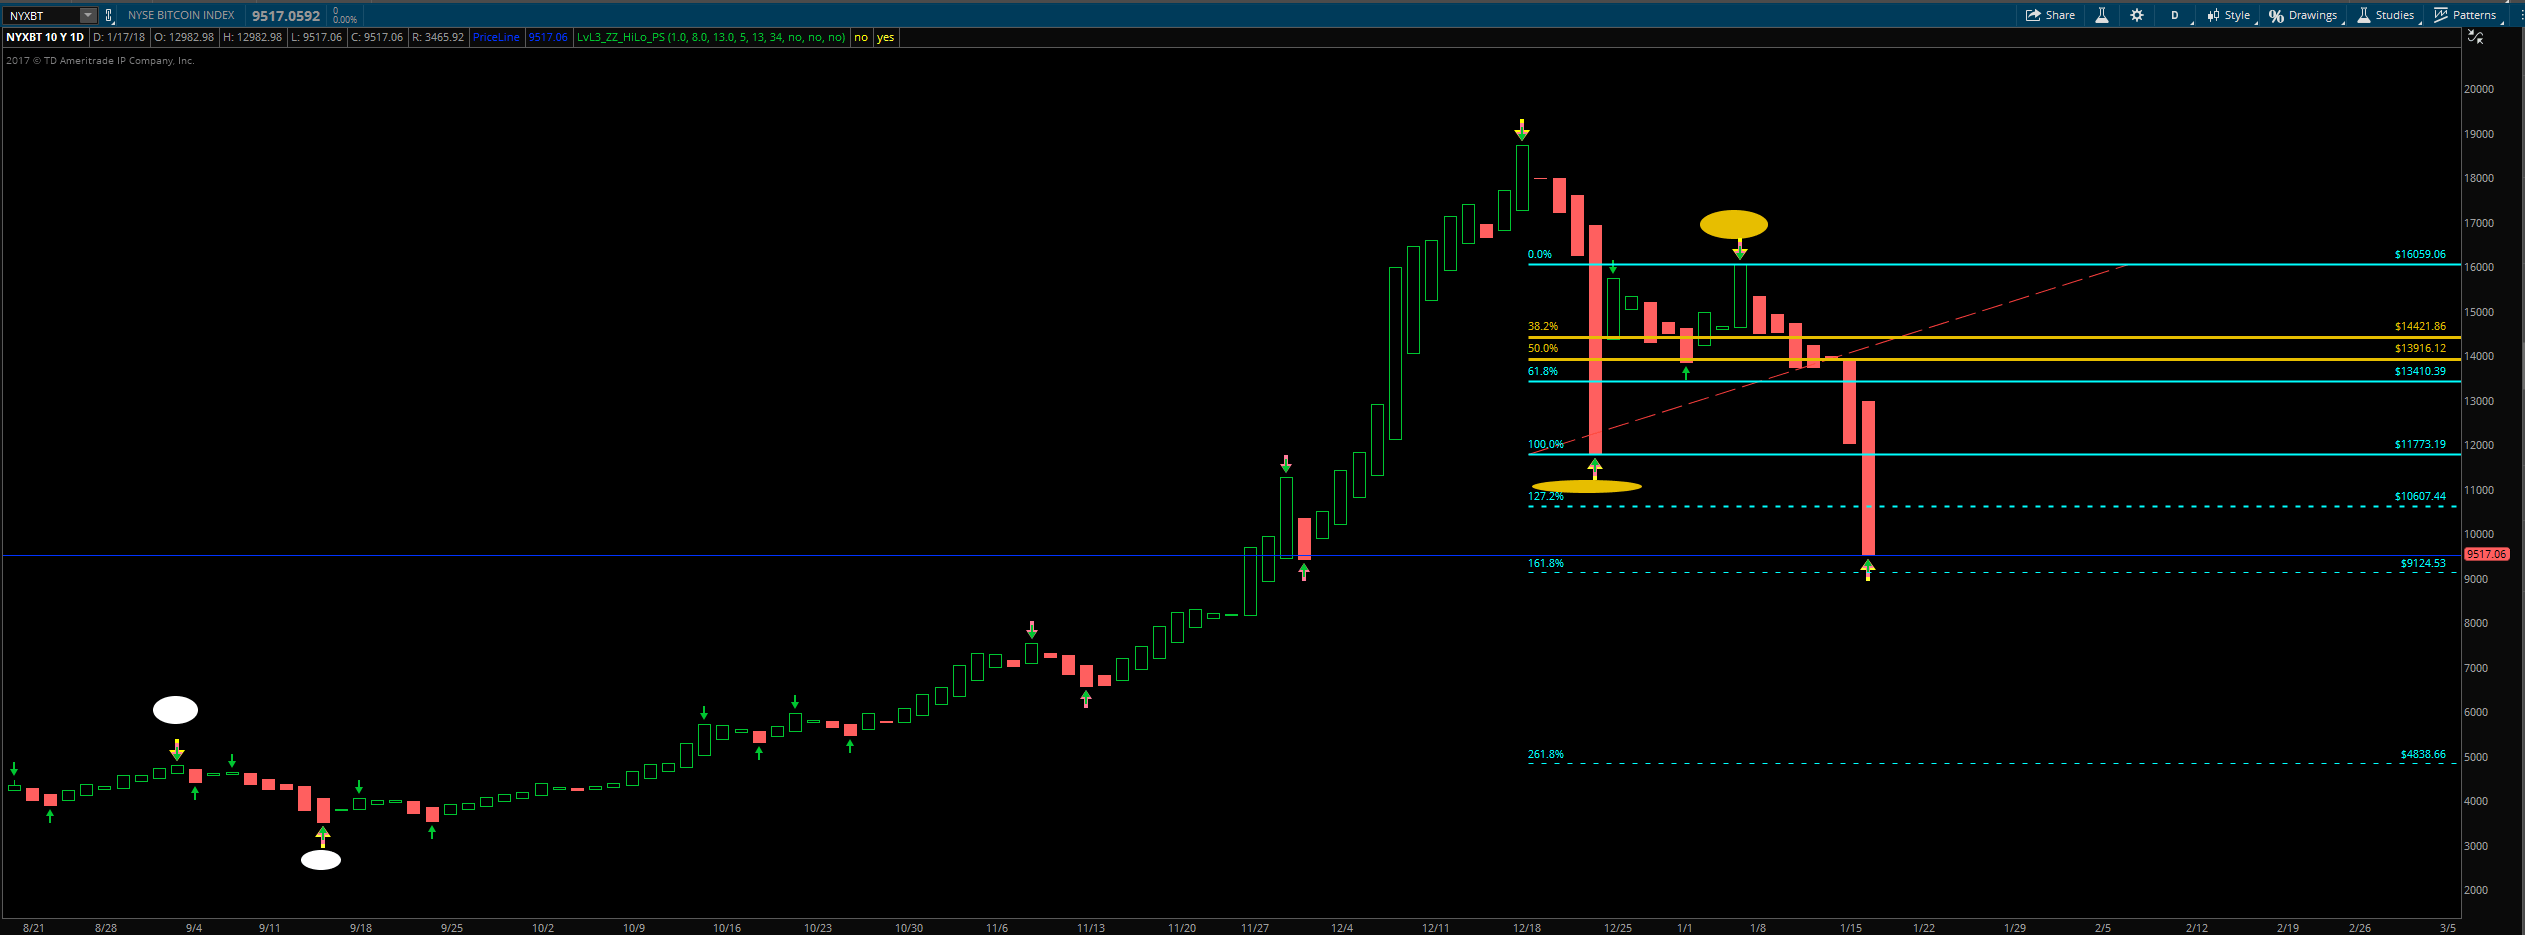
Bitcoin is very close to the 161% fib extension. From the previous chart you will see that price stopped at the mid-line of Andrew’s Pitchfork which is an area of support. If price blows through that area then this thing is going to at least the 261.8% fib extension which is at $4,838.66. The lowest point I could see this move going would be the 361% fib which is at $587.08 (I don’t really use the 361% fib extension anymore but a lot of people do). I doubt very much this move goes down there. This is the pull back that Bitcoin needed because it was out of control from last September to December.
Buy here?
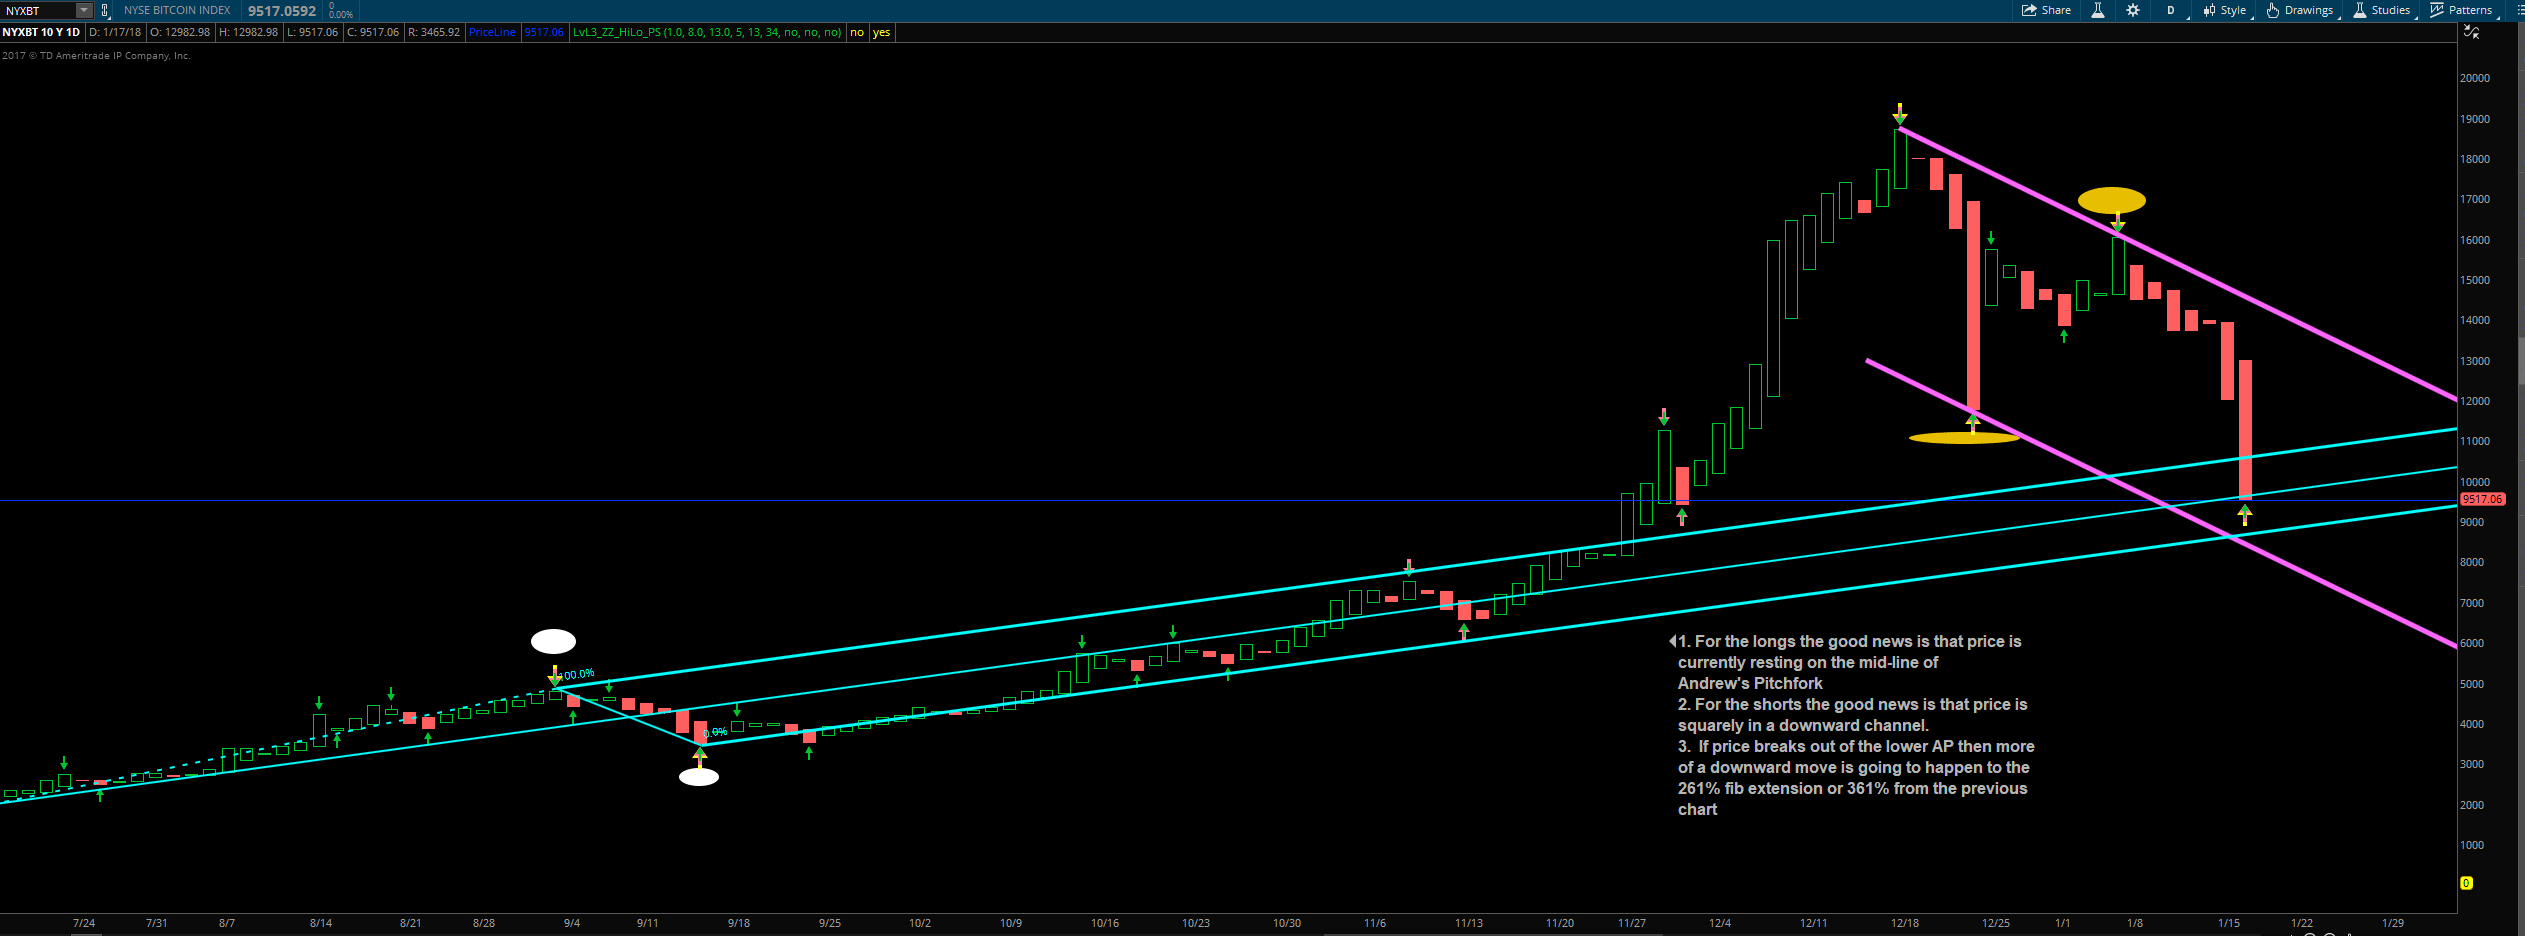
If this was me looking to get long I would wait and see what happens at the crossroads between Andrew’s Pitchfork and the downward trend channel. I would like to see price hold steady within AP and then breaks out of the downward channel, then I would get long. If that is what happens then look for the breakout to occur between February 7th – 16th.
Fib Extension Cluster?
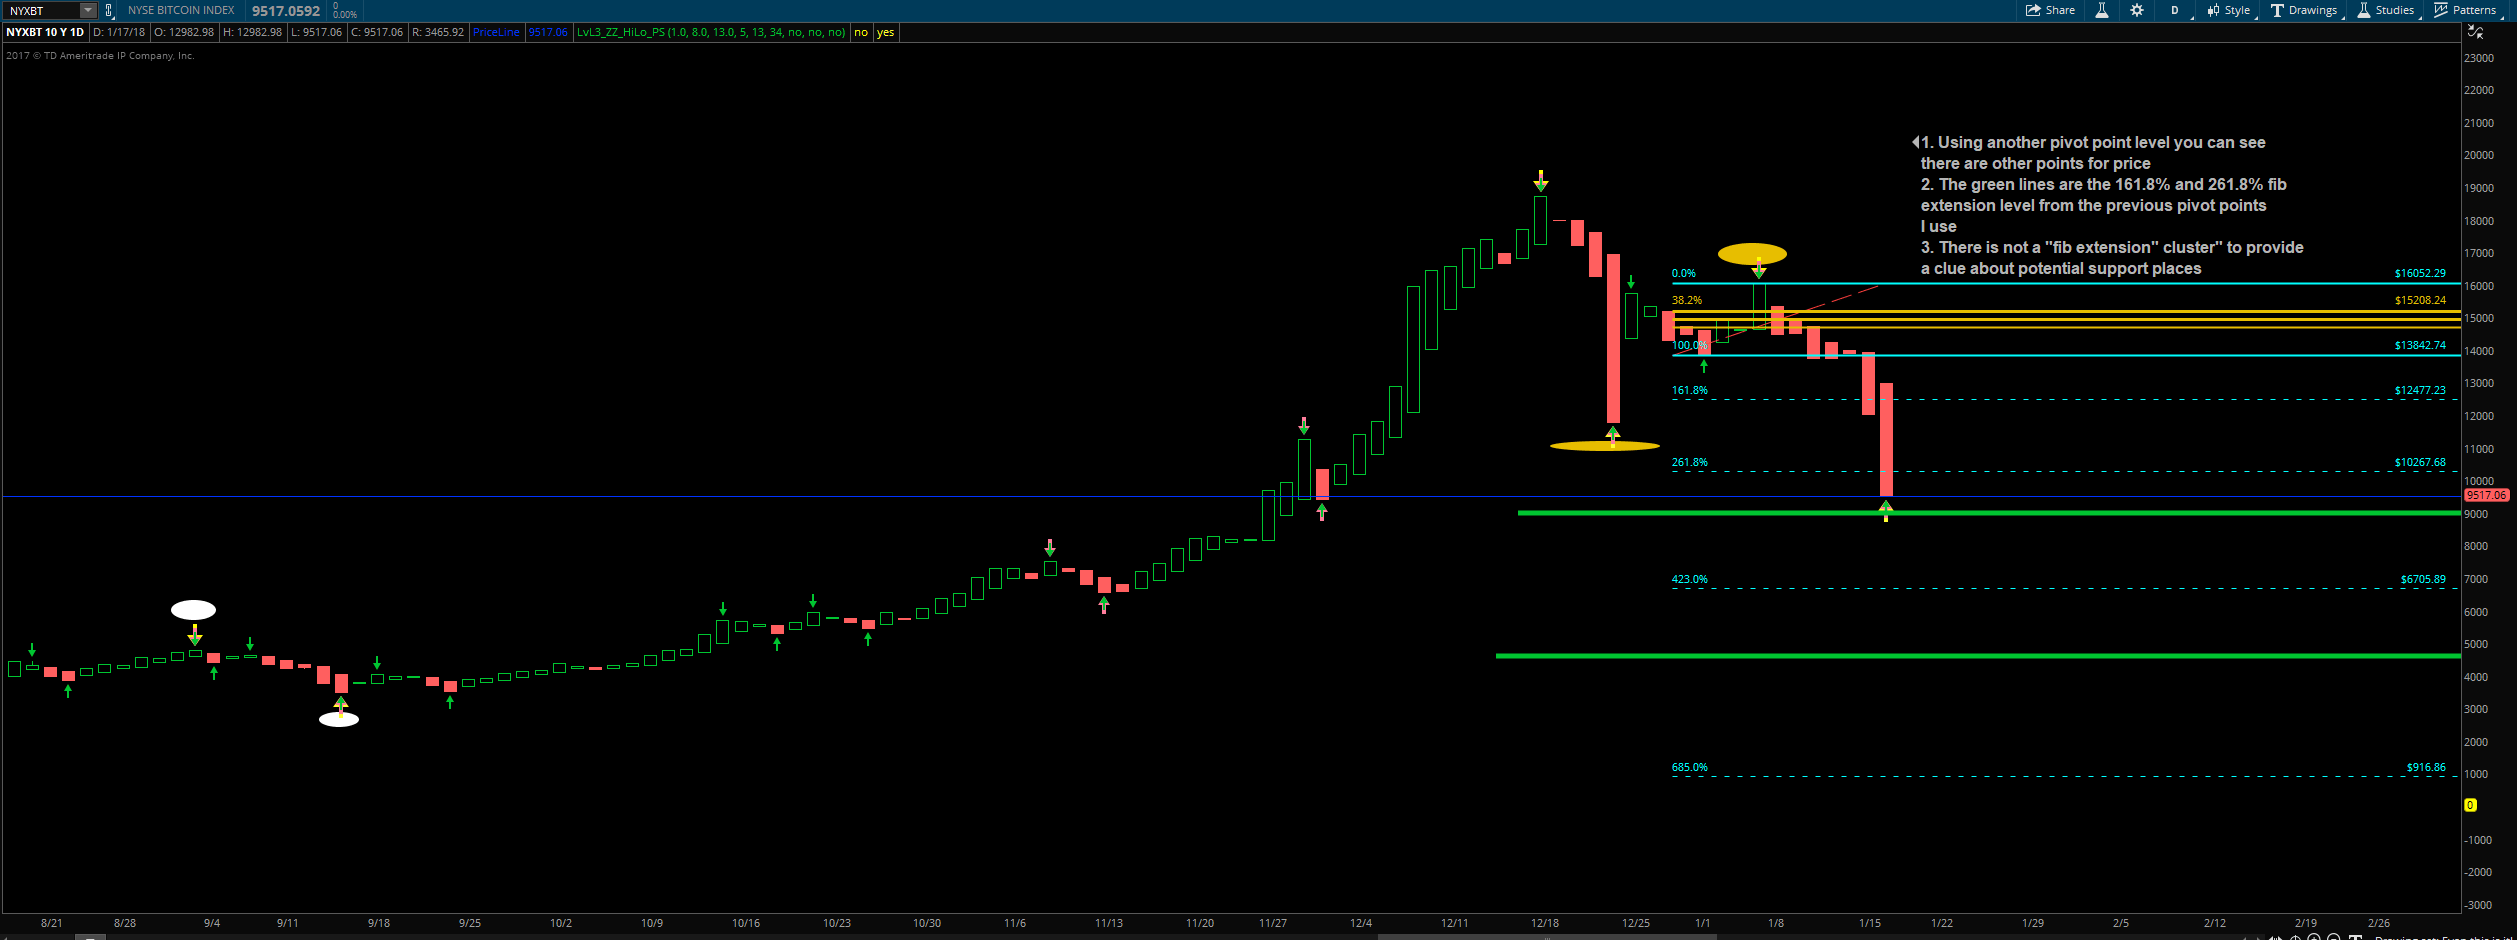
From using another valid pivot point area I was looking to see if there was an area of clusters of fib extensions from the previous valid pivot points I used to measure in the other charts and the new one here. The green lines are the 161.8% and the 261.8% fib extension area from the previous charts. Unfortunately there is not an area of clusters to give us a clue of a potential support area.
Conclusion
I am kind of all over the place here. I usually like to give a definite buy/sell here call if I was using my money. Currently I would wait and see what happens with the battle of AP and the downward trend channel as mentioned above.

