Bitcoin over the past couple of weeks has broken out of the congestion and is over $6,000. Since Bitcoin has created a new long setup, how much more room does it have to run? In this post, we will look at it from the daily chart, the hourly chart, and the 15-minute chart. I have been long Bitcoin, even when the price was in the low $3,000s and I plan on holding for longer.
I doubt this next run up will be like it was when the price skyrocketed up to around $20,000 now that the institutions and hedge funds are involved. There will be more shaking people out but this could be the 1st leg up of a nice run.

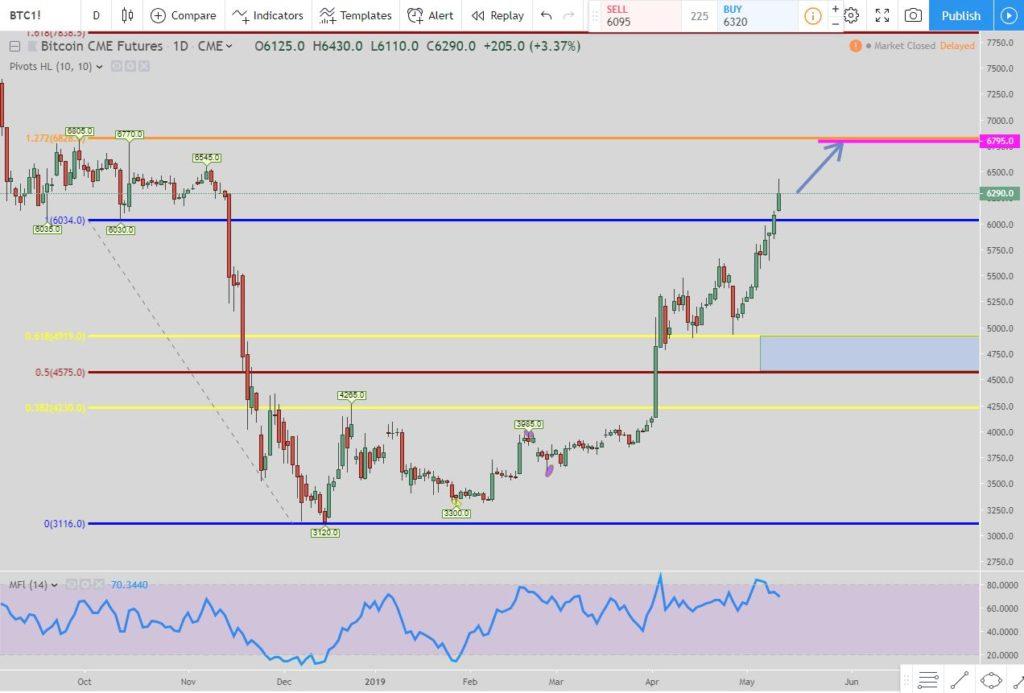
Bitcoin daily longWhen Bitcoin broke the blue line it initiated the reverse lightning trade long setup. The current exit is the pink line at $6,795.
This is the daily chart using this setup. But if the price doesn’t hit the pink line and retraces down to the 38% Fibonacci retracement then that is where you will enter next and the exit will move to the blue line of 6024. Lastly, if the price continues to retrace without hitting the exit then your next entry is the bottom blue line at 3106. This will be the last time you would move the exit even if the price goes lower than 3106. The exit moves to the 50% level at 4565.

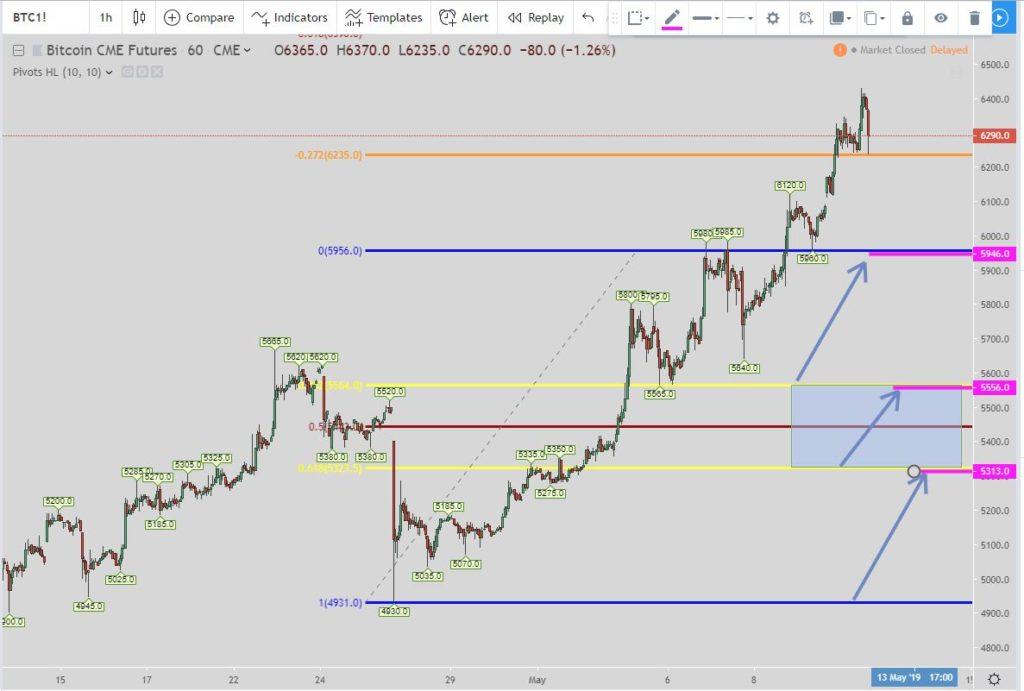
Here we are just waiting for a retracement in the 1-hour chart for a long setup. The arrows next to the lines: 38%, 61%, and 100% Fibonacci levels are the entries.
The exits are the pink lines. Once the price goes and hits the exit then that whole move is over and time to look for another setup. Right now we are just waiting.
So if the price hits the 38% and then goes up and hits the 0% line without hitting the other two entries then the move is over and DO NOT get in at those other two levels from this move.

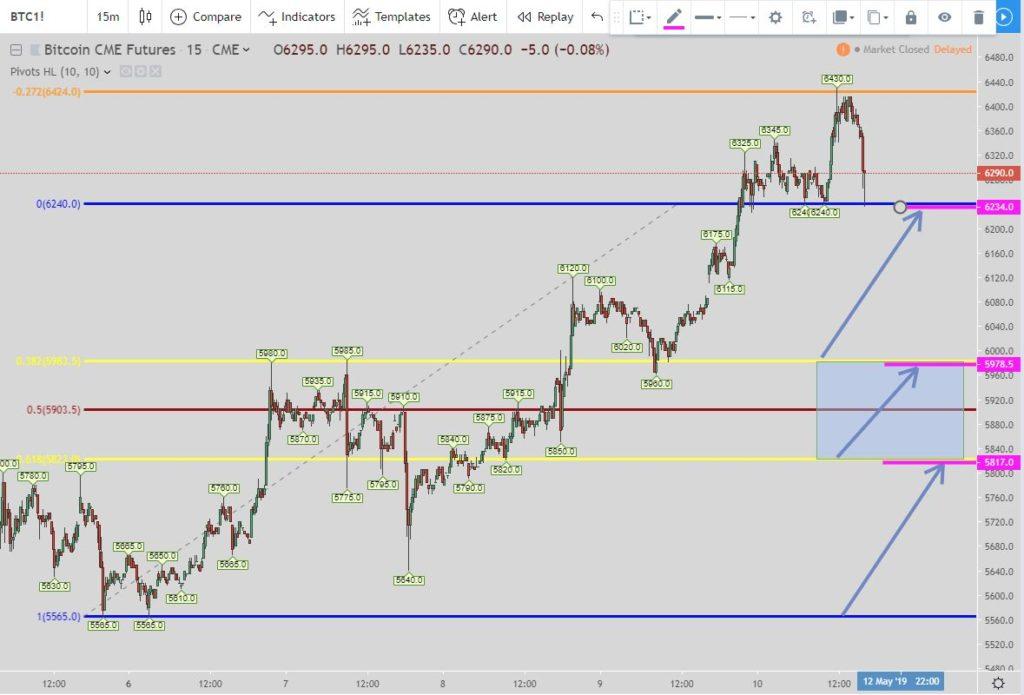
The 15-minute chart is the same as the 1 hour in the view that I am still waiting on a retracement to happen. I could use more pivot points but these are enough for this current setup.
Conclusion for Bitcoin Has Created a New Long Setup, How Much More Room to Run?
The daily chart is showing the most promise for a breakout. It doesn’t mean Bitcoin will continue to move straight up and hit it. But if there is a retracement then the 1-hour chart and the 15-minute chart provides entries and opportunities to take advantage of it.
Popular Links
Here are a couple of links if you are looking at how I view the market and some trade setups. You can create your own trading style and setups. Quit paying losing traders to teach you. The only thing they teach is how to lose money.
Robinhood Trading Broker
If this post benefits you and if you haven’t used Robinhood for trading stocks but are thinking to then please consider using my referral link when you do sign up: http://share.robinhood.com/evanc203.
This way each of us will receive a free share of a random stock if you sign up through my referral link.
My Robinhood Review: https://evancarthey.com/review-robinhood-trading-service-with-no-fees-part-1/


