In this post we will look at Ameren (AEE): The Stock that Only Moves Higher. Now that isn’t entirely true but since the low of $19.51 in 2009 the stock has gone from the bottom left to the upper right of the stock chart. Today it is around $76.00. We will look at the fundamental markers of what I look for in a growth stock. We will also look at the setups based upon my technical trade setups to see if there are any trading opportunities.
Ameren (AEE): The Stock that Only Moves Higher – Fundamentals
There are 7 fundamental markers I look for in a stock. I try to only purchase growth stocks so these are the parameters I look for to see if a stock meets the majority of the markers. I prefer to have all seven fulfilled. You can it more in depth here: https://evancarthey.com/how-to-scan-for-winning-stocks-an-insiders-view-to-my-process/
- Market Cap: > $300 million
- EPS growth past 5 years: >0%
- P/E: Over 10
- EPS growth next 5 years: >0%
- Sales growth past 5 years: Over 20%
- Debt/Equity: <0.1
- Sales growth qtr over qtr: Over 5%
Does the stock meet these 7 markers?
- Market Cap: 18.88B (YES)
- EPS growth past 5 years: 9.60% (YES)
- P/E: 22.04 (YES)
- EPS growth next 5 years: 4.90 (YES)
- Sales growth past 5 years: 1.50% (NO)
- Debt/Equity: 1.21 (NO)
- Sales growth qtr over qtr: -1.80% (NO)
I used Finviz.com for the fundamental analysis screener.
With Ameren only meeting 4 of the 7 growth marker parameters then I would not consider this a growth stock. But Ameren obviously doesn’t care about my growth markers because their stock has been going up and up since 2009.
Technical Analysis
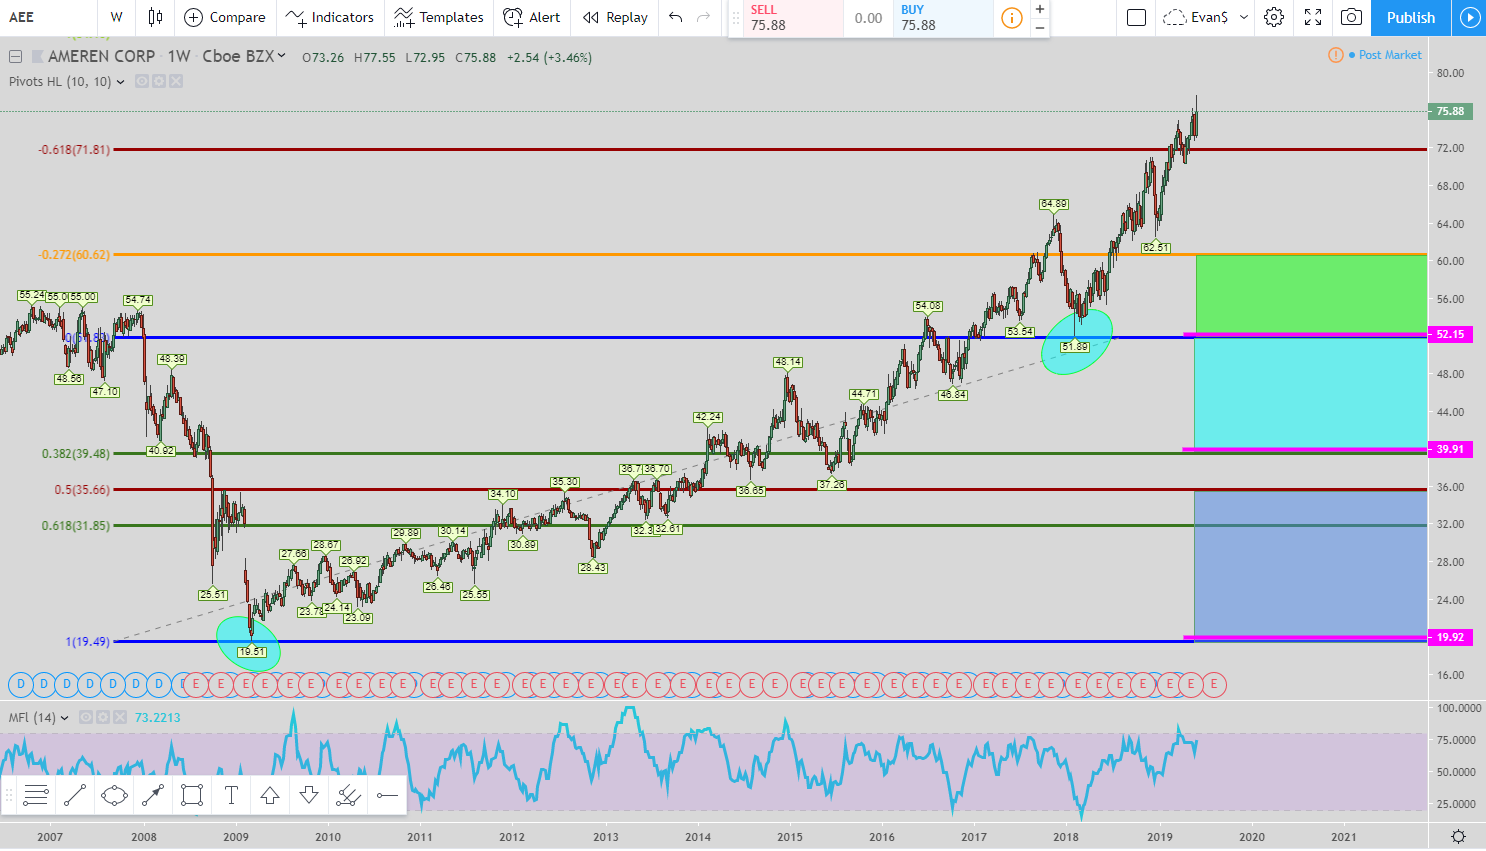
In this setup we are looking at the 161 Long Setup. The setup used to be called the 127 Setup but after some more tweaking I make sure price hits the 161.8% Fibonacci extension rather than the 127.2% before I look for the retracement. That is why the name change.
In the weekly chart above we are waiting for price to retrace and hit the top pink line at $52.15. When it does that will initiate the trade and the exit will be the top of the green box at around $60.00. But if the exit is not hit and price moves down and hits the middle pink line at $39.91 then the exits move to the top of the teal box around$51.30. Finally, if that exit is not hit and price continues to move lower and hits the bottom pink line at $19.92 then all exits move to the top of the blue box at around$35.25.
If an exit is hit and there are still un-entered entries then take them off because the move is over. It is time to look for a new setup.
The final exit is the top of the blue box. Even if price goes lower than $19.92 (the bottom pink line) the exit does not move again.
Conclusion for Ameren (AEE): The Stock that Only Moves Higher
Since I am not a breakout or trend trader I really don’t have any live setups going on. It is in wait mode for the stock price of Ameren to retrace back to the levels I mentioned in the chart above. Their fundamentals are not very good in terms of growth markers but that hasn’t stopped the stock from moving constantly higher since 2009.
Popular Links
Here are a couple of links if you are looking at how I view the market and some trade setups. You can create your own trading style and setups. Quit paying losing traders to teach you. The only thing they teach is how to lose money.
Robinhood Trading Broker Review
If this post benefits you and if you haven’t used Robinhood for trading stocks but are thinking to then please consider using my referral link when you do sign up: http://share.robinhood.com/evanc203.
This way each of us will receive a free share of a random stock if you sign up through my referral link.
My Robinhood Review: https://evancarthey.com/review-robinhood-trading-service-with-no-fees-part-1/

