The Amazon stock forecast for 2019 will more than likely be applicable to 2020. Over the past 2 years, I have done several posts about Amazon. This post will focus on the 2 setups I have been using, the 76.4% and the 8.236%. If there is a Springboard setup then I will look at that as well. So really we’ll look to see if 3 setups will work with where Amazon is for the technical side.
Here are some of the posts I have done on Amazon in the past:
- Technical Analysis for Facebook, Apple, Netflix, & Google – FANG
- Amazon (AMZN) is prime for a quick short
- Technical Analysis for Amazon (AMZN) – Is it set up for another run up or a retracement?
- Amazon (AMZN): Will the Stock Continue Higher or Consolidate?
As my trading style continues to evolve I want to do an update on Amazon and how I view what the stock is doing. Meditation has been the key to discovering what setups and trading style works for me. It is free and easy. The best of both worlds.
The only thing that stops me from meditating is my laziness which is really sad because all you really have to do is sit/lay down and close your eyes. Then observe whatever thoughts or feelings arise in you. Eventually, they will subside and you will be in “the gap.” That is where you will start to discover the trading style and setups that work with the way you want to trade.
So get started today and see how your trading can be improved by incorporating meditation into your daily routine. Even if it is for just 1 minute per day, do it. 1 minute is better than 0. Consistency is the key.
If you are looking for coverage on the fundamentals then check out the article Investopedia did: Is Amazon Going to Be Worth $6,000 Per Share? (AMZN). It provides more insight regarding most of the fundamental analysis for the stock.
Here are the highlights from the article:
There is no guarantee that for the next 10 years Amazon can maintain its most recent annualized sales growth rate of 25% but we will use 25% as an estimate. Although companies typically do not maintain such high growth rates for so long, Amazon has been entering numerous new markets and regularly announcing new, innovative partnerships. In just the second half of 2018, Amazon announced plans to build new headquarters in New York City and Northern Virginia, that it will be launching a new partnership with the ABC reality series “Shark Tank,” expanding the capabilities of Alexa and much more – so there is reason to believe in its extended revenue growth.
The calculations show a one-year price target of $2,115 which is in line with analysts’ one-year price target of $2,170. With the 25% annual rate of sales growth Amazon could be worth $6,455 in 2024.
Amazon Charts
Below will be the charts that I will go over in the video. You will be able to click on them to make them bigger so they are easier to view. All charting is done through TradingView.

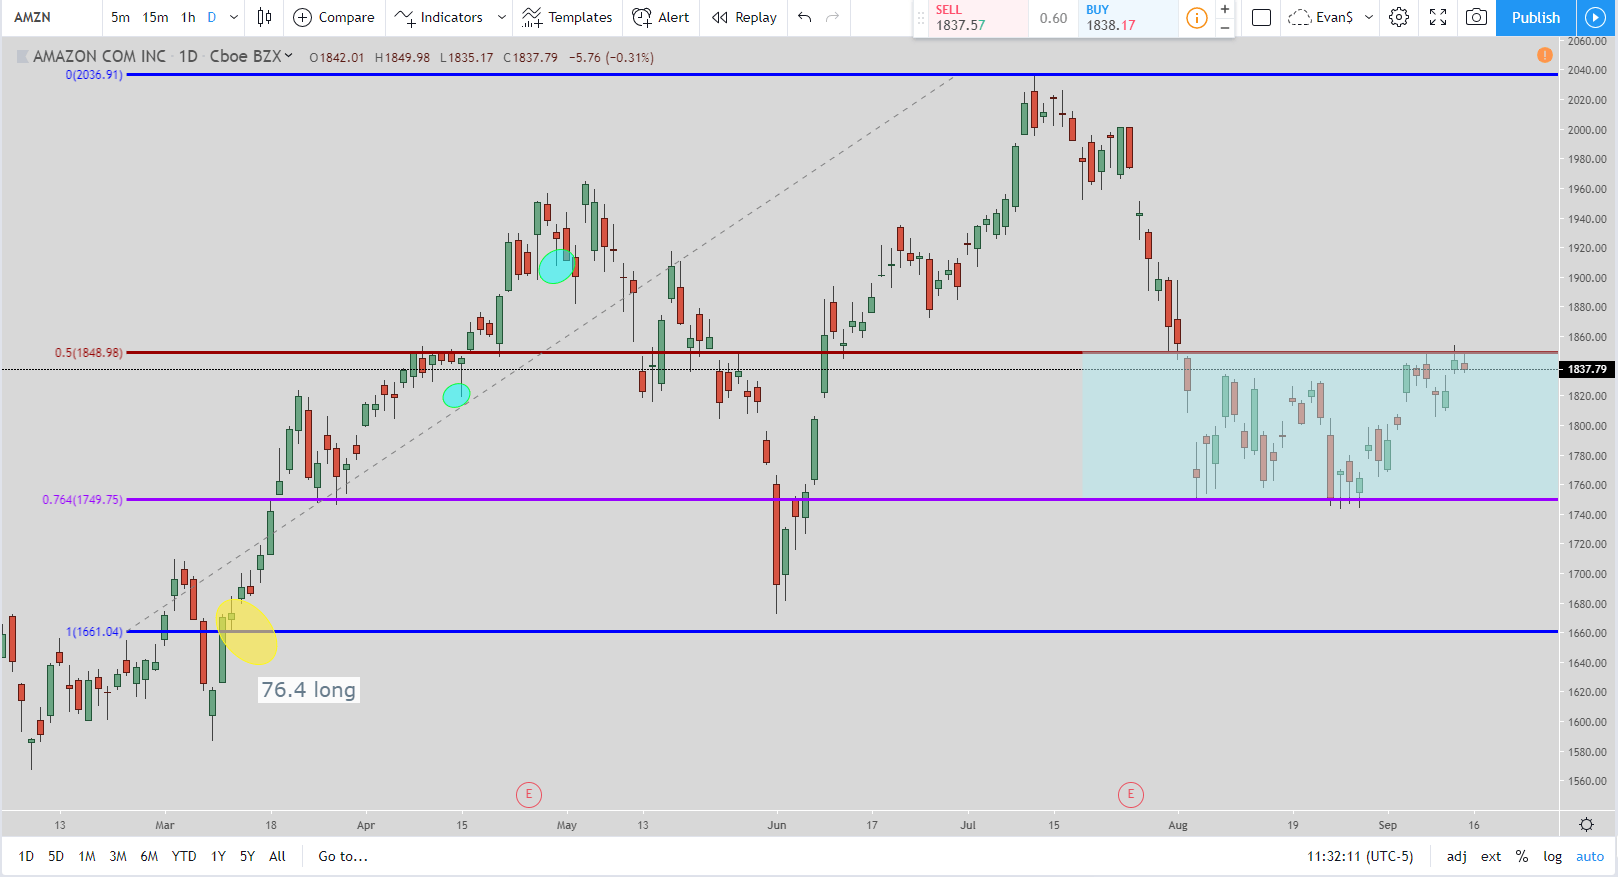
The chart above is a 76.4% long that was just completed this week. The entry was the 76.4% Fibonacci retracement level and the exit was the 50% level. The entry was at around $1,750 and the exit was around $1,848.
I wanted to include this setup to show one that literally was just completed. The time frame used was the daily chart.

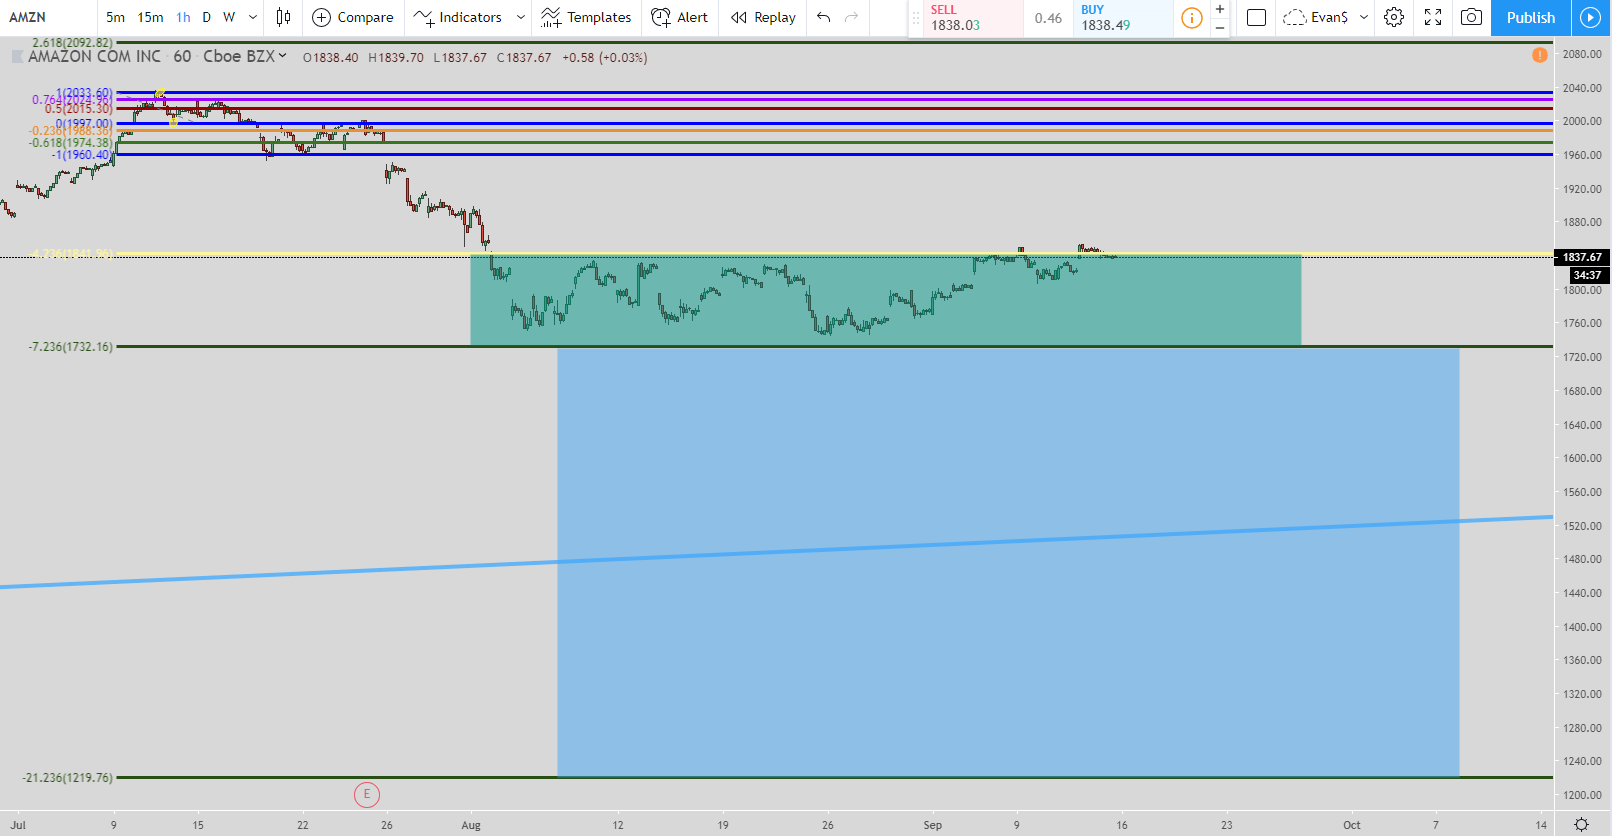
Here is a 1 hour chart that is a potential long. The setup hasn’t been initialized yet because we need the bottom of the green box which is around $1,733. The exit would be the top of the green box around $1,836. But if the price continues to go lower all the way down to the bottom of the blue box around $1,220 then the exit moves to the top of the blue box around $1,731.
The setup used is the 8.236% long setup for the chart above.

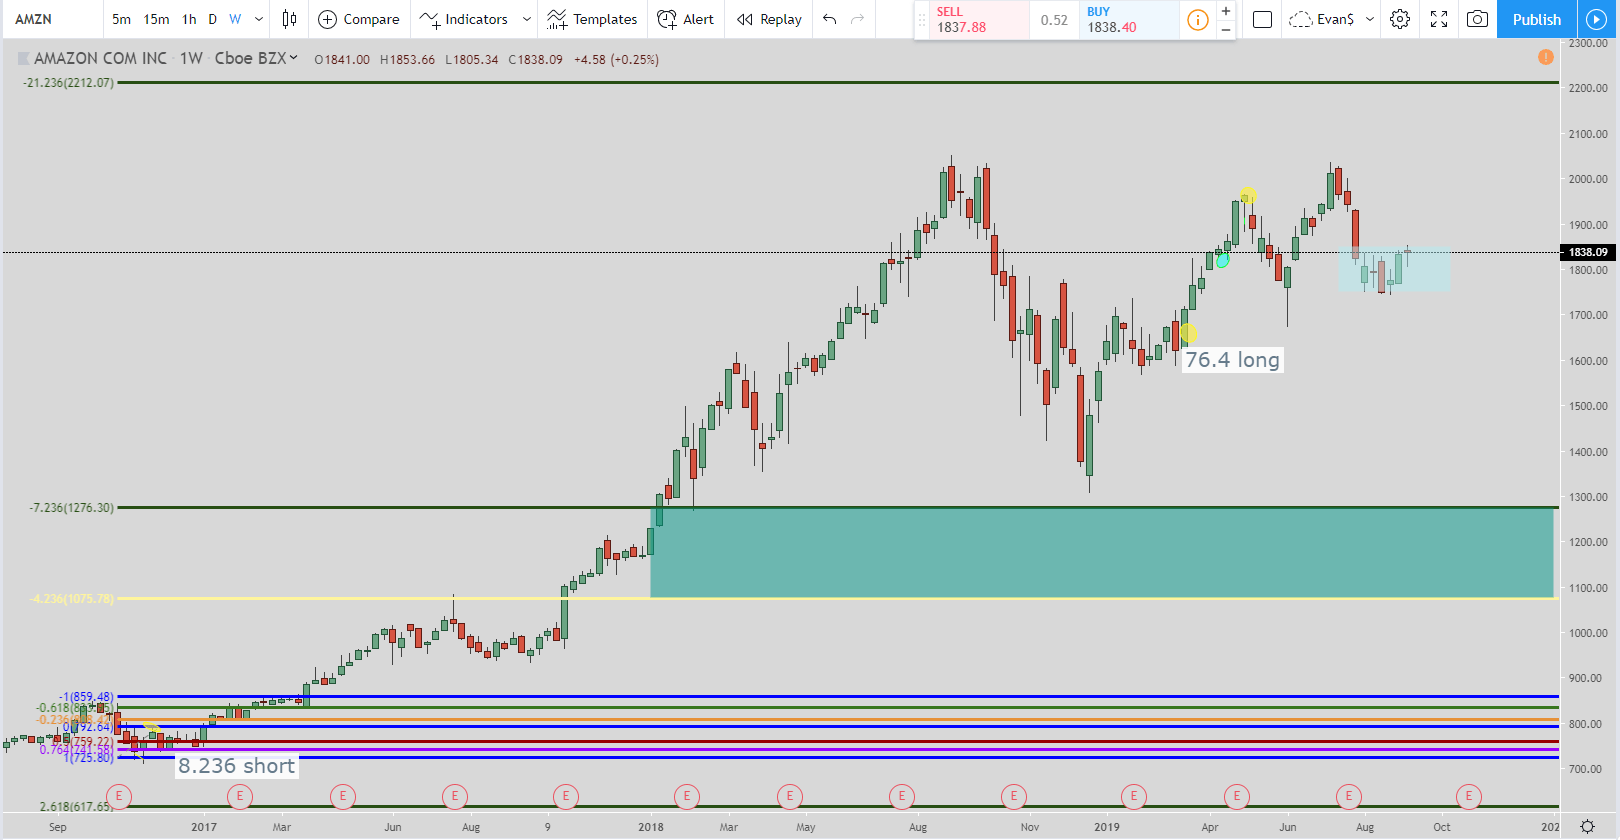
In the chart above we are looking at the 8.236% short trade. The current exit is the bottom of the green box which is around $1,080. But if the price moves up and hits the top green line which is the 22.236% Fibonacci extension level at $2,212 then the exit would move to $1,278.
But this only happens if the price hits the 22.236% level and does not hit $1,080. If the price hits $1,080 first then the setup is over and time to look for another setup.

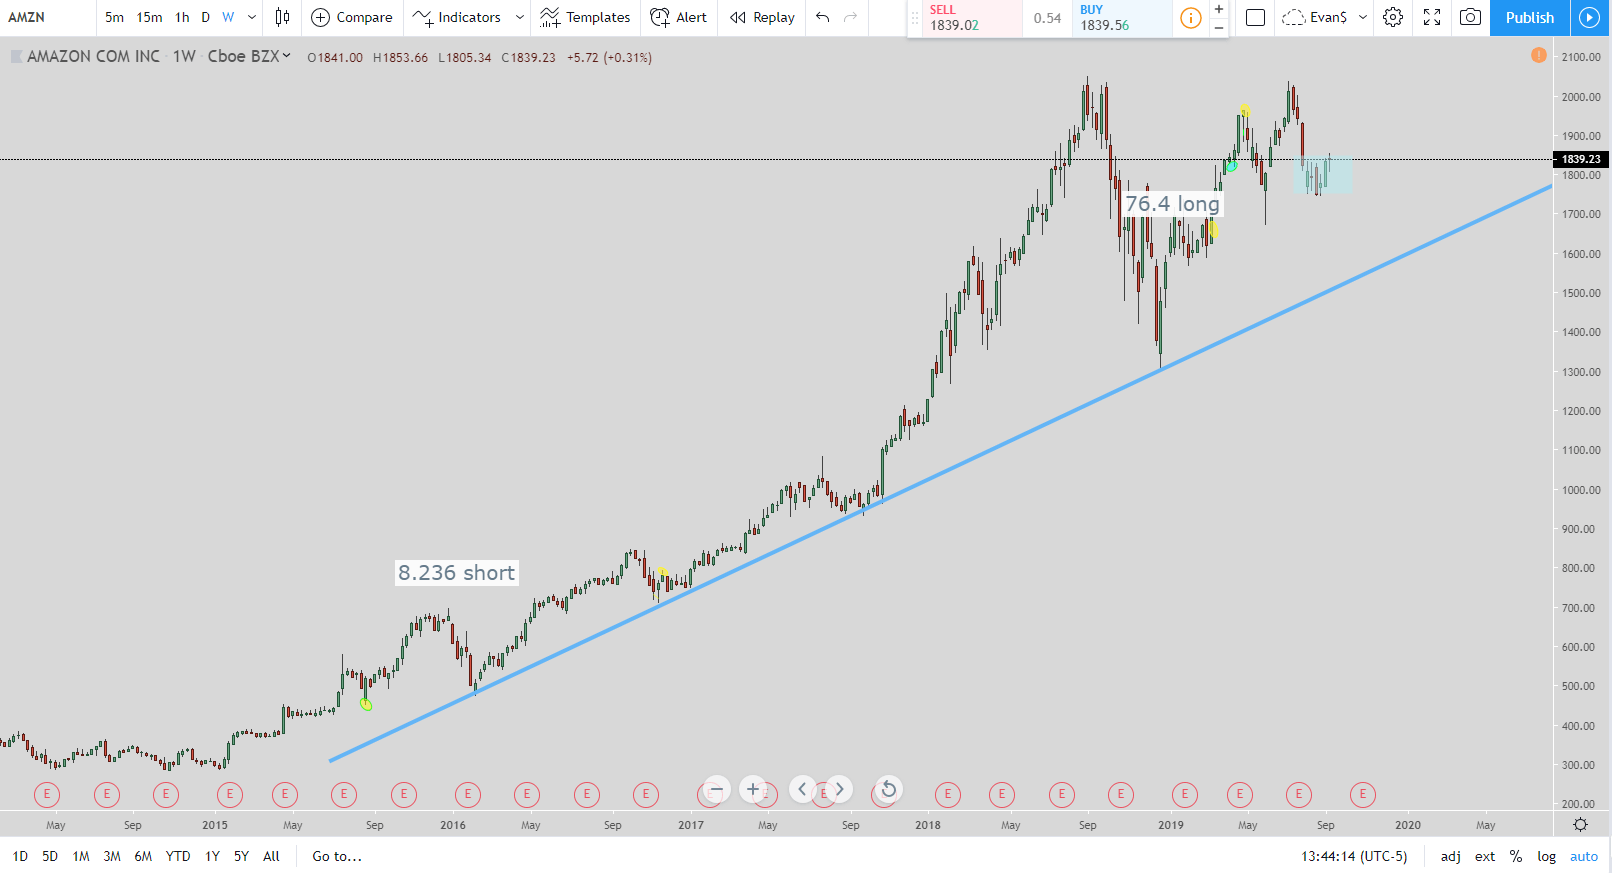
But one thing I have learned is to wait until the trend line break before getting in a trade. Sometimes I do not always follow this but it keeps me safe. Do you see that trend-line in the chart above? In my opinion, I would wait until it is broken before I would short Amazon.
Obviously you may miss out on some profit but what if the stock keeps on going up and does not retrace until it is broken? Then you can be in Amazon for a long time before the retracement happens.
That is why I try to wait until a trend line break before getting in. Sometimes a new trend can form so this doesn’t guarantee a 100% trend reversal but it does show that there is a weakness in the stock. This is how a “perfect” trade takes place from the trades I take using the Fibonacci extension and retracement levels.
I used to take them blindly. What I mean by that is I would go long or short when a specific Fibonacci number was hit. For the most part, it worked but when you had a move go against you then it could last for a long time. So one concept I incorporated was watching for a trend line break plus hitting the Fibonacci level I am looking for. This does cost you to miss out on some trades or miss some profit but in my opinion, it is better to play it safe. That is what waiting for a trend line break does. It helps keep you safer.
Plus, a lot of the time the price will come back up and use the bottom of the trend line as resistance after it has its initial breakout when looking for a short.
Video for Amazon Stock Forecast for 2019
If you cannot view the video then click on this sentence to be taken to it.
Conclusion for Amazon Stock Forecast for 2019: At the Top or Another Run-Up?
I love Amazon. From a consumer standpoint, I use them every single month to buy stuff from. Their stock price has shown the superior service and products they supply. Back in the early 2000’s when it was under $5.00 until today to where it is around $1,838. Their growth has been amazing.
To be honest, I would not get in front of this stock if you are looking to short. What I would do is wait until the trend line breaks at a minimum. But if you want to be even safer is to wait for the pullback to the trend line to be used as resistance after the trend line break as mentioned in one of the pictures involved. I go over what I am trying to explain about this in the video above.
In the meantime, I would wait for pullback setups to go long with for Amazon. Until Amazon shows us that it is in a downtrend then I would look for any weakness as a buying opportunity.


