Today we are going to look at AES Corp (AES) to see if their stock is setup to go higher or collapse. By collapse I don’t mean melt down to $0, I mean it more in terms of a retracement. We will look at the 7 fundamental parameters I look to see if a stock can be considered a growth stock. Then we will take a look at the technical analysis side using the setups I have created and use for my trades. I have no plans to own AES in the next 72 hours and do not hold any positions in AES Corp (AES).

AES Corp (AES): Is Their Stock Set to Go Higher or Collapse?
There are 7 fundamental markers I look for in a stock. I try to only purchase growth stocks so these are the parameters I look for to see if a stock meets the majority of the markers. I prefer to have all seven fulfilled. You can it more in depth here: https://evancarthey.com/how-to-scan-for-winning-stocks-an-insiders-view-to-my-process/
- Market Cap: > $300 million
- EPS growth past 5 years: >0%
- P/E: Over 10
- EPS growth next 5 years: >0%
- Sales growth past 5 years: Over 20%
- Debt/Equity: <0.1
- Sales growth qtr over qtr: Over 5%
Does the stock meet these 7 markers?
- Market Cap: 11.70B (YES)
- EPS growth past 5 years: 32.30% (YES)
- P/E: 11.48 YES
- EPS growth next 5 years: 7.60% (YES)
- Sales growth past 5 years: -7.50% (NO)
- Debt/Equity: 6.01 (NO)
- Sales growth qtr over qtr: -0.80% (NO)
I used Finviz.com for the fundamental analysis screener. With AES hitting only 4 of the 7 markers it is not a growth stock. AES Corp doesn’t have very good fundamentals for what I look for to see if a stock is a growth stock. In fact these are some of the worst numbers I have seen so far. A huge Debt/Equity ratio and negative sales numbers for past and current growth is terrible.
Before I would trade just about any stock that fit my technical parameters. Unfortunately, I have had to learn the hard way that the fundamentals of a stock are just as important (if not more) than the technical setups.
Technical Analysis of AES Corp (AES)
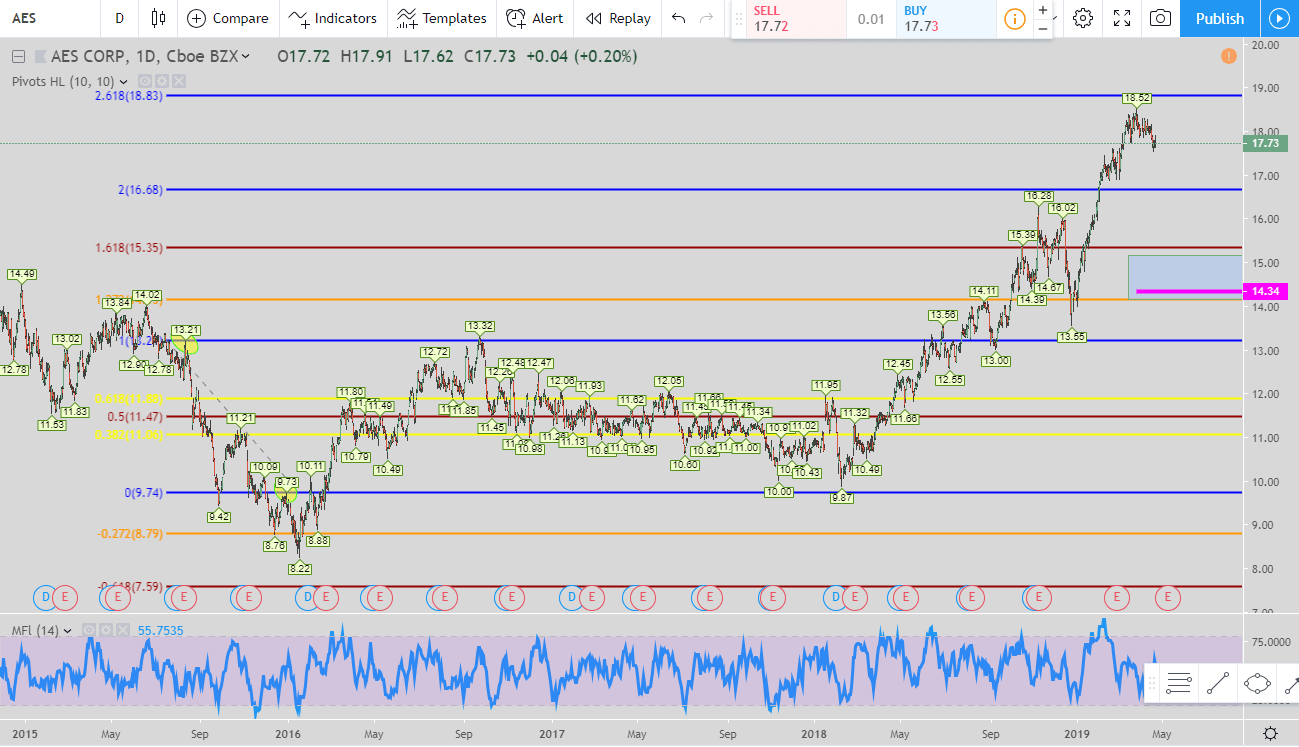
In a new setup I will be using which is entitled New Reverse Lightning Trade Short (the name will be shortened when I come up with something better) there is currently a short setup for AES Corp.
If you get in now at around $17.73 then the exit is the pink line at $14.34. If price continues to move up and goes higher than $18.52 then you would use $9.73 as the bottom of your Fibonacci retracement. You would then use the new pivot point high as the top of the Fib retracement move. Then look for the 50% retracement level and that is your exit.
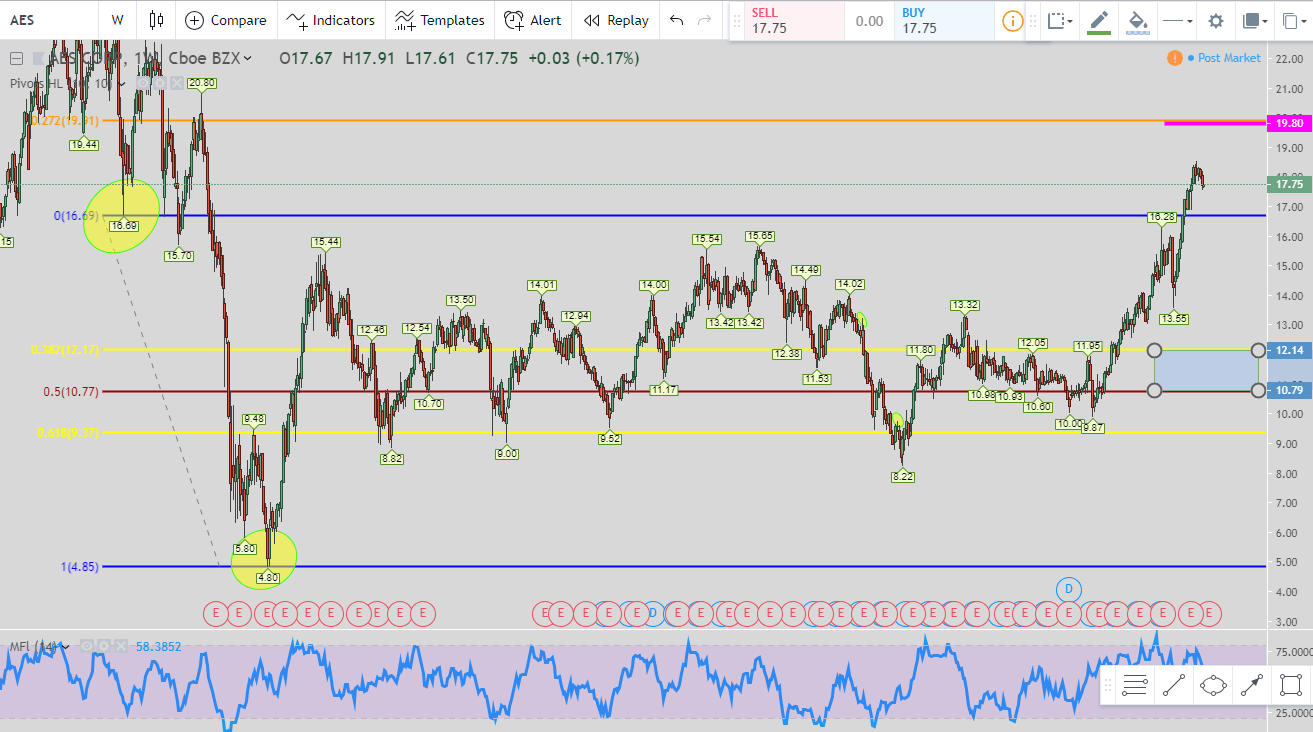
There is also a long setup going on for AES Corp. A new setup I have discovered is the same principles as my Reverse Lightning Trade setup but now I use the bottom pivot points rather than the top for a long setup.
Price has broken out of the blue line and the current exit is the pink line at $19.80. I had to use the weekly time-frame for this because AES Corp has been in consolidation for years. If price does go up and fill that target then that will open up another long setup.
Popular Links
Here are a couple of links if you are looking at how I view the market and some trade setups. You can create your own trading style and setups. Quit paying losing traders to teach you. The only thing they teach is how to lose money.
My Robinhood Shameless Plug
If this post benefits you and if you haven’t used Robinhood for trading stocks but are thinking to then please consider using my referral link when you do sign up: http://share.robinhood.com/evanc203.
This way each of us will receive a free share of a random stock if you sign up through my referral link.
My Robinhood Review: https://evancarthey.com/review-robinhood-trading-service-with-no-fees-part-1/


