Today we are going to look at Akami Technologies (AKAM) to see how you should consider trading the stock. In glancing at their chart it has been in a very strong uptrend. We will also look at the fundamentals as well to see if the trend is set to continue. We will look at the 7 fundamental parameters I look to see if a stock can be considered a growth stock. Then we will take a look at the technical analysis side using the setups I have created and use for my trades. I have no plans to own Akami Technologies in the next 72 hours and do not hold any positions in AKAM.

Akami Technologies (AKAM): How to Trade the Stock – Fundamentals
There are 7 fundamental markers I look for in a stock. I try to only purchase growth stocks so these are the parameters I look for to see if a stock meets the majority of the markers. I prefer to have all seven fulfilled. You can it more in depth here: https://evancarthey.com/how-to-scan-for-winning-stocks-an-insiders-view-to-my-process/
- Market Cap: > $300 million
- EPS growth past 5 years: >0%
- P/E: Over 10
- EPS growth next 5 years: >0%
- Sales growth past 5 years: Over 20%
- Debt/Equity: <0.1
- Sales growth qtr over qtr: Over 5%
Does the stock meet these 7 markers?
- Market Cap: 13.08B (YES)
- EPS growth past 5 years: 2.00% (YES)
- P/E: 44.65 YES
- EPS growth next 5 years: 15.30% (YES)
- Sales growth past 5 years: 11.50% (NO)
- Debt/Equity: 0.49 (NO)
- Sales growth qtr over qtr: 8.30% (YES)
I used Finviz.com for the fundamental analysis screener. With Akami Technologies hitting 5 of the 7 markers it is very close to being a growth stock. Akami Technologies has missed two of the markers but they are pretty close. This is a stock to keep an eye on.
Technical Analysis for Akami Technologies
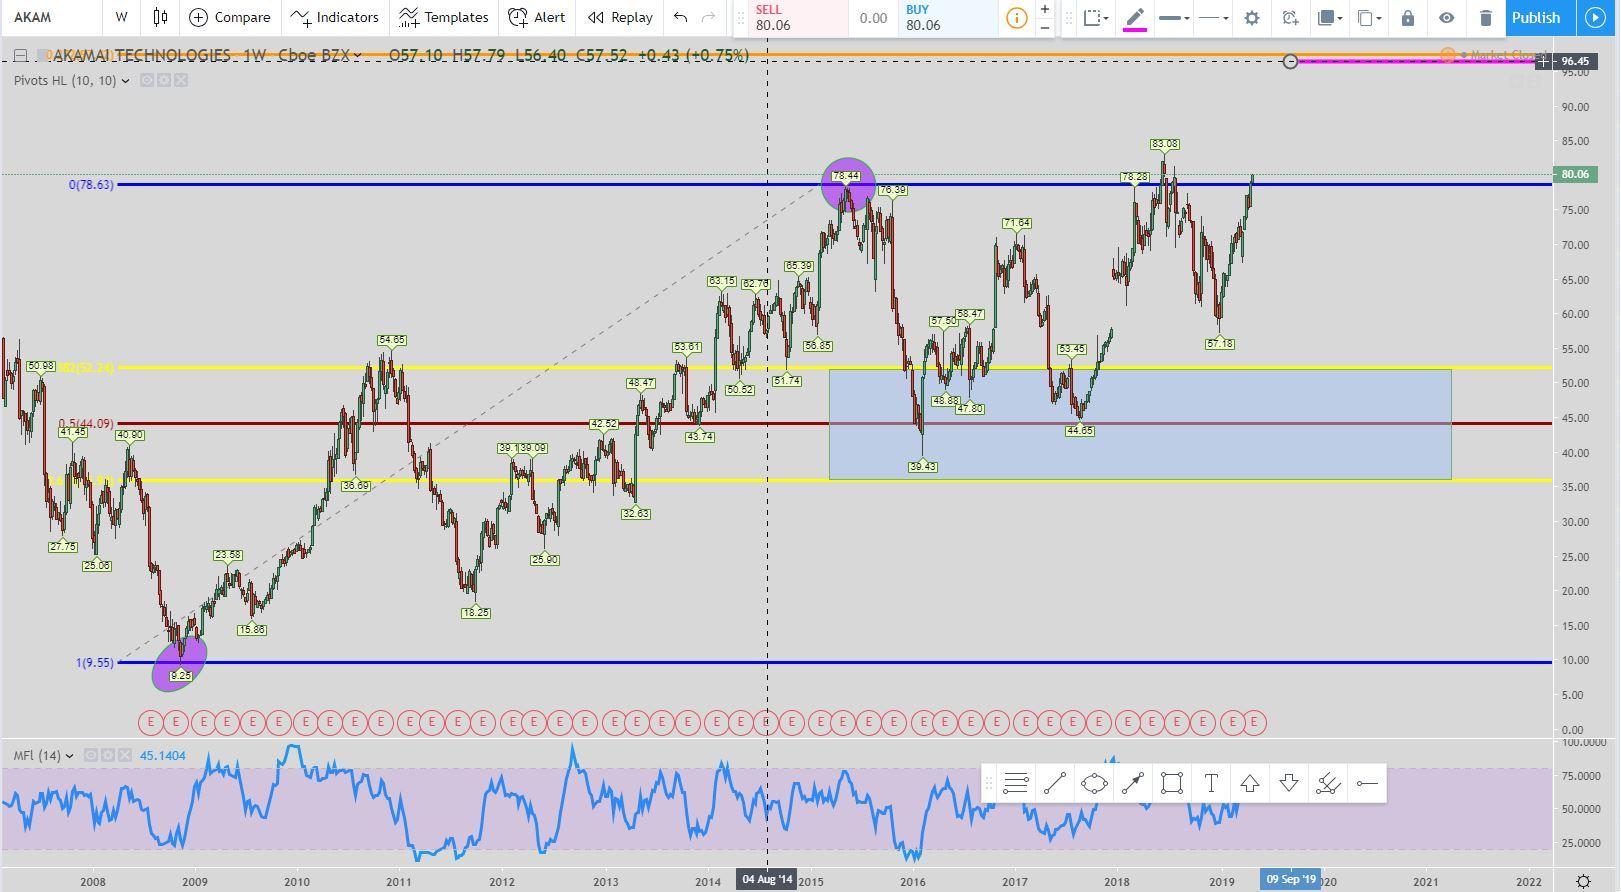
Akami Technologies is currently in a 38-127 long setup. The target we are looking to hit is the pink line at $96.45.
This is using the weekly time frame so it could be years until it is hit. Even then it may never be hit. If price retraces down to the 61.8% Fibonacci level at $36.20 then the exit would move to the 38% level at around $52.00.
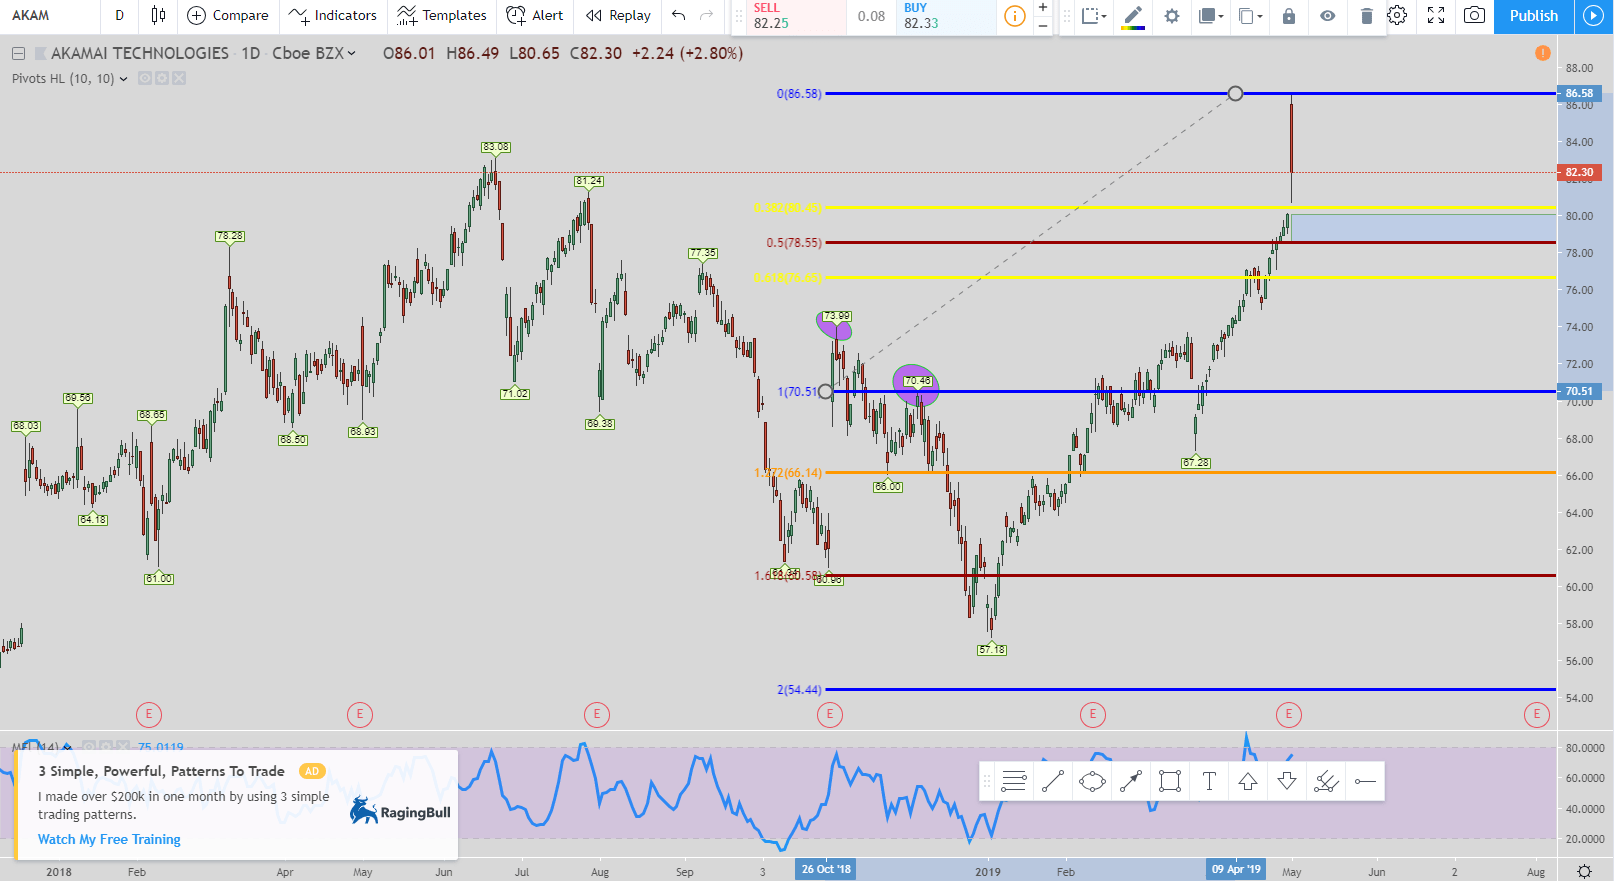
There is also a short setup live right now. It is the 50B short setup. If the current high holds then the exit is the 50% Fibonacci retracement level at $78.55.
But if the price moves back up and makes new highs before hitting the 50% retracement then you would move the Fibonacci top level up with it. The short move is over once price hits the 50% Fibonacci retracement level.
Popular Links
Here are a couple of links if you are looking at how I view the market and some trade setups. You can create your own trading style and setups. Quit paying losing traders to teach you. The only thing they teach is how to lose money.
Robinhood Trading Broker
If this post benefits you and if you haven’t used Robinhood for trading stocks but are thinking to then please consider using my referral link when you do sign up: http://share.robinhood.com/evanc203.
This way each of us will receive a free share of a random stock if you sign up through my referral link.
My Robinhood Review: https://evancarthey.com/review-robinhood-trading-service-with-no-fees-part-1/

