Altria is better known for being one of the largest producers of tobacco. This post will be about Altria Group (MO): Has the Stock Gone Up in Smoke? The stock used to be considered one where you could park your money and pick up a very nice dividend north of 6%. On top of that you would receive steady returns as the stock steadily kept going higher. But since the high of around $77 in June of 2017 the stock has been trending lower and is currently around $50. We’ll take a look at the fundamentals for what I look for to see if a stock is a growth stock.
We’ll also look at the technical setups based upon how I trade to see what opportunities there are to trade the stock.
Altria Group (MO): Has the Stock Gone Up in Smoke? – Fundamentals
There are 7 fundamental markers I look for in a stock. I try to only purchase growth stocks so these are the parameters I look for to see if a stock meets the majority of the markers. I prefer to have all seven fulfilled. You can it more in depth here: https://evancarthey.com/how-to-scan-for-winning-stocks-an-insiders-view-to-my-process/
- Market Cap: > $300 million
- EPS growth past 5 years: >0%
- P/E: Over 10
- EPS growth next 5 years: >0%
- Sales growth past 5 years: Over 20%
- Debt/Equity: <0.1
- Sales growth qtr over qtr: Over 5%
Does the stock meet these 7 markers?
- Market Cap: 94.47B (YES)
- EPS growth past 5 years: 10.80% (YES)
- P/E: 14.85 (YES)
- EPS growth next 5 years: 7.18% (YES)
- Sales growth past 5 years: 0.70% (NO)
- Debt/Equity: 2.07 (NO)
- Sales growth qtr over qtr: -7.90% (NO)
I used Finviz.com for the fundamental analysis screener.
With Altria only hitting 4 of the 7 growth markers then this definitely is not a growth stock. In my opinion it is still very interesting if you are thinking of parking money in it to collect the dividend. But if you are looking for a growth stock then this is not it.
Technical Analysis
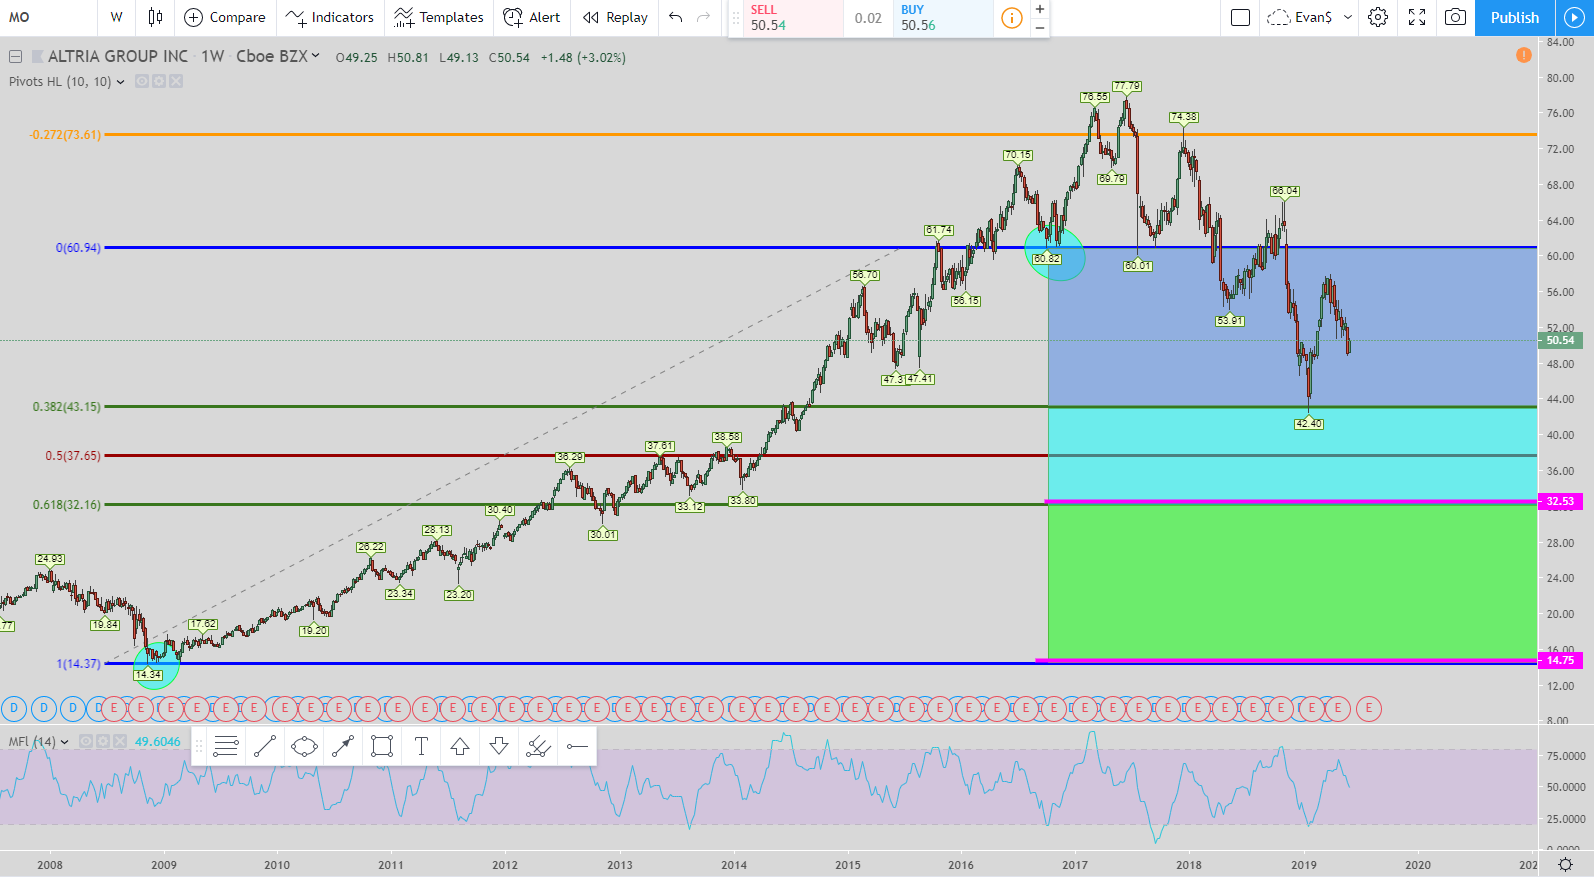
The first setup will be the 61B long setup using the weekly chart. So this is a very long term trade. When price went down and hit the 38% Fibonacci retracement then that initiated the trade. The current exit is the top of the blue box at around $60.00. But if price does not hit $60 and continues to move lower then the next exit is the pink line at $32.53. If that is hit then the exit moves to the top of the teal box at around $43.00. Finally, if that exit is not hit and price moves lower then the next entry is the pink line at $14.75. If that is hit then the exit moves to the top of the green box around $32.00
That is the final time the exit will move. Even if price moves lower you do not move the exit.
If price hits an exit at any point then the move is over. Do not get in at any unfilled entries if the exit is hit. The setup is over and time to look for a new one.
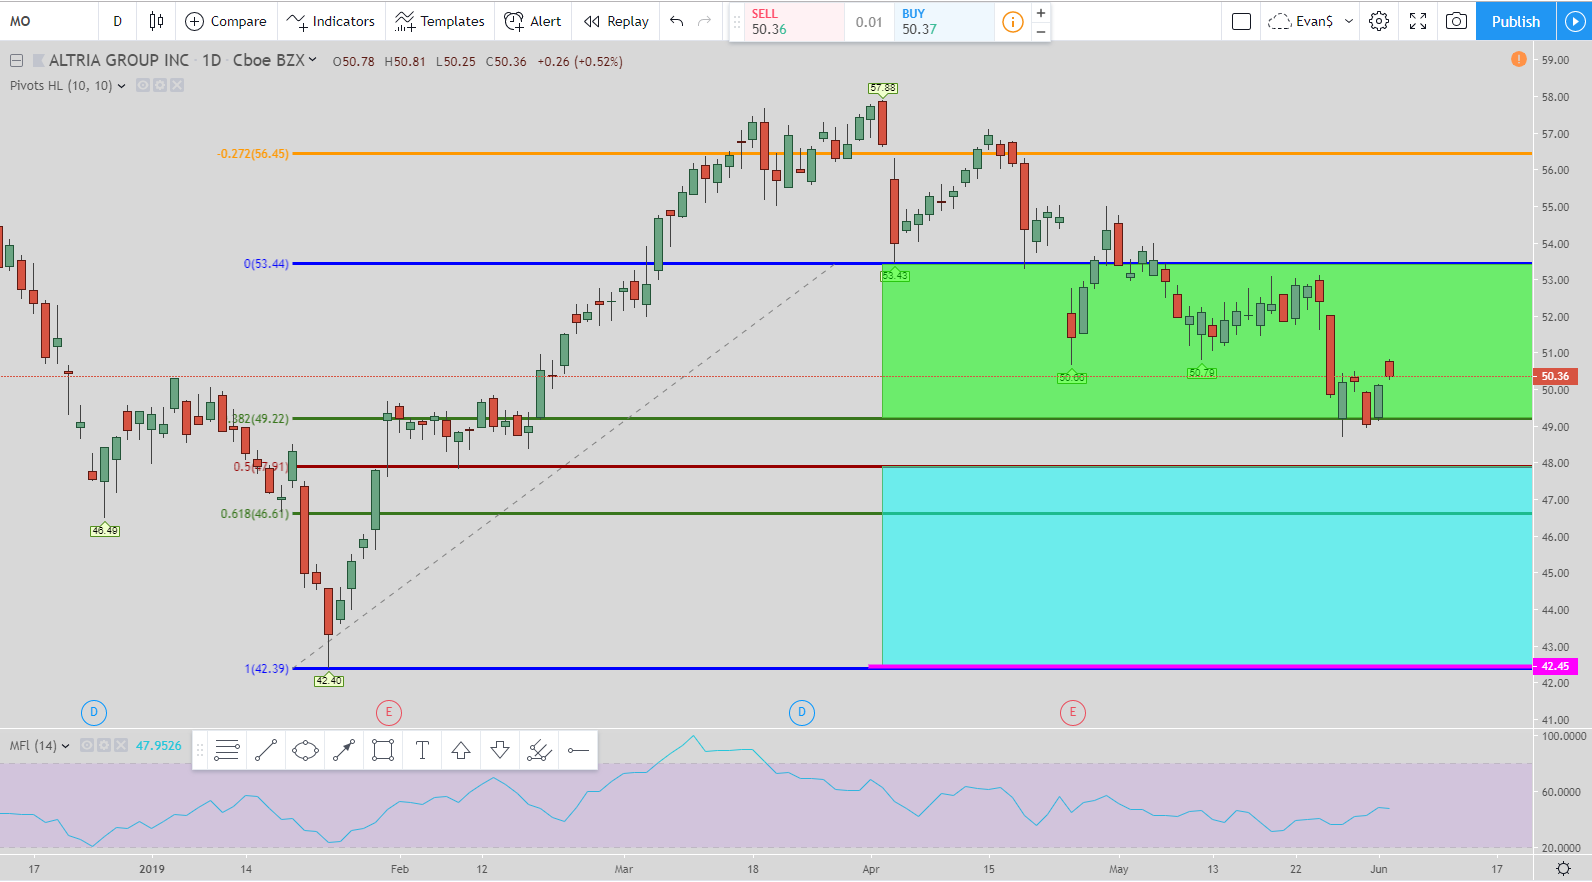
This chart is the daily time frame and we are using the 127 Long Trade Setup. The 1st entry which is the 0% Fibonacci line has already been taken out so we are now in the green box. The current exit is the top of the green box at around $53.35. But if price continues to move down without hitting the top of the green box then the next entry will be the pink line at $42.45. If price hits that then the exit will be at the top of the teal colored box at around $47.90. That will be the last time the exit moves even if price continues to move down.
Conclusion for Altria Group (MO): Has the Stock Gone Up in Smoke?
Altria is in the middle of two long setups. The fundamentals are not the best but it does have a really good dividend. If you are looking for a very long term play then this could be a stock to consider if you plan on collecting the dividend while you wait for the move to complete.
Popular Links
Here are a couple of links if you are looking at how I view the market and some trade setups. You can create your own trading style and setups. Quit paying losing traders to teach you. The only thing they teach is how to lose money.
Robinhood Trading Broker Review
If this post benefits you and if you haven’t used Robinhood for trading stocks but are thinking to then please consider using my referral link when you do sign up: http://share.robinhood.com/evanc203.
This way each of us will receive a free share of a random stock if you sign up through my referral link.
My Robinhood Review: https://evancarthey.com/review-robinhood-trading-service-with-no-fees-part-1/


