Toll Brothers (TOL) Just Reported Earnings, Are They a Buy?
Toll Brothers (TOL) reported earnings today and it was not the best of news. Their new home orders dropped 24 percent in the fiscal first quarter, the steepest annual decline for the biggest U.S. luxury home builder since the depths of the housing crash in 2010. The company struggled to find move-up buyers in California, which is gripped by an affordability crisis. https://finance.yahoo.com/news/toll-brothers-orders-plunge-california-144209405.html
The majority of my analysis will be on the technical analysis side for Toll Brothers (TOL). I will also briefly look at a couple of fundamental markers I look for to see if it passes those.

The Fundamentals
There are 7 fundamental markers I look for in a stock. You can it more in depth here: https://evancarthey.com/how-to-scan-for-winning-stocks-an-insiders-view-to-my-process/
- Market Cap: > $300 million
- EPS growth past 5 years: >0%
- P/E: Over 10
- EPS growth next 5 years: >0%
- Sales growth past 5 years: Over 20%
- Debt/Equity: <0.1
- Sales growth qtr over qtr: Over 5%
Does Toll Brothers meet these 7 markers?
- Market Cap: 5.38B (YES)
- EPS growth past 5 years: 36.70% (YES)
- P/E: 7.98 (NO)
- EPS growth next 5 years: 1.05% (YES)
- Sales growth past 5 years: Over 21.70% (YES)
- Debt/Equity: 0.78 (NO)
- Sales growth qtr over qtr: 21.1% (YES)
Toll Brothers meets 5 out of 7 markers for what I look for when purchasing a stock. I prefer to have 7 out of 7. Based upon my own opinion Toll Brothers has characteristics of being a growth stock but not all of them. It still seems like a solid stock even though it isn’t what I consider a growth stock. I like growth stocks because to me they provide the greatest potential for sustained gains to fill my technical analysis.
I used http://finviz.com on 2/27/2019 to come up with these numbers for the fundamentals.
The Technical Analysis for Toll Brothers (TOL)

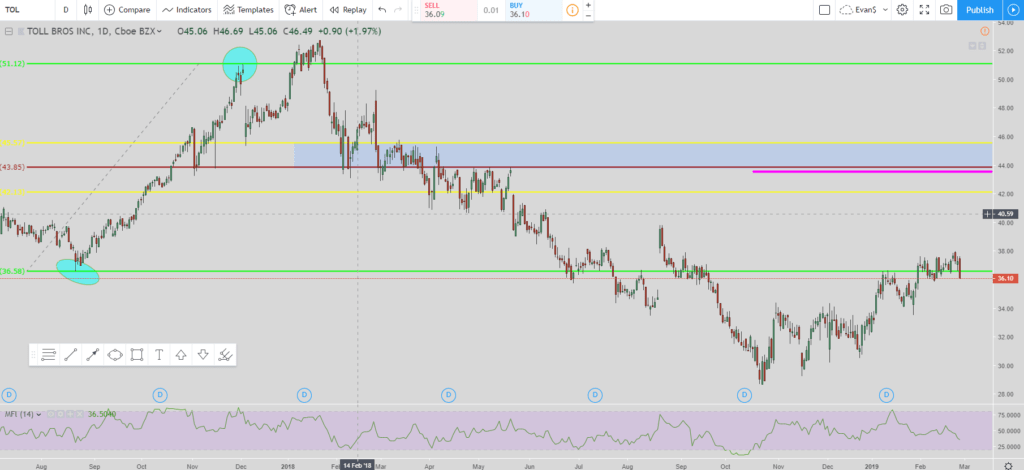
From the image above we are looking at Toll Brothers (TOL) using my Lightning Trade setup. You can see the two teal circles which are the pivot points used. Price initally broke out but never hit the 127.2% Fibonacci extension level. Then it proceeded to blow past the 38% Fibonacci retracement level and the 0% which is the bottom green line.
The exit is the pink line at $43.50. With price currently at $36.14 there is good room for Toll Brothers to run up to. If you are looking at buying the stock then this would be a good area since the exit is at $43.50. Even if price goes lower you don’t have to move the exit down. It is the final exit based upon my Lightning Trade setup. You can of course get out anytime you wish but that will be the exit that will end this buy side Lightning Trade Setup.
I try to get in on all of my stock trades near the 0% Fibonacci level (the lower green line). If I can get in even better then excellent! That way I know my final exit is just south of the 50% Fibonacci retracement level and doesn’t have to move unless I want to lock in some gains and get out early. I can always get back in as long as the 50% Fibonacci retracement level has not been hit. Once it does then the move is over and time to look for another setup.
Recap
Toll Brothers meets 5 out of the 7 markers I look for on the fundamental side. In the technical analysis side it is at a good area if you are looking at purchasing the stock. At the current time of this writing I do not own Toll Brothers (TOL) and do not have plans to make any purchase of their stock in the next 24 hours. All views are my own opinion and should not be taken as financial advice.
If this post benefits you and if you haven’t used Robinhood for trading stocks but are thinking to then please consider using my referral link when you do sign up: http://share.robinhood.com/evanc203.
This way each of us will receive a free share of a random stock if you sign up through my referral link.
My Robinhood Review: https://evancarthey.com/review-robinhood-trading-service-with-no-fees-part-1/


