The S&P 500 still has some great long setups and one I am waiting on to eventually begin. At the end of last week a couple of short setups formed. Going into next week I think we’ll see weakness at the beginning of the week but eventually, price will rebound back and could be setting the stage for another move higher based on how this uptrend has formed in 2 other areas that I talk about in this video.
Last week the targets we had for the S&P 500 chart were filled. At the end of the week, the bottom dropped out of the market but that is fine. It needs to have some pullback. If price pops back up then there are some intriguing setups to the long side.
It is still in a bull run but there are now some shorting opportunities available. If you follow me on Twitter (ecarthey) then you’ll see this Tweet I did about this S&P 500 chart (15-minute) being ready for a long. I expect at least some more downside before price does pop back up, at least temporarily.
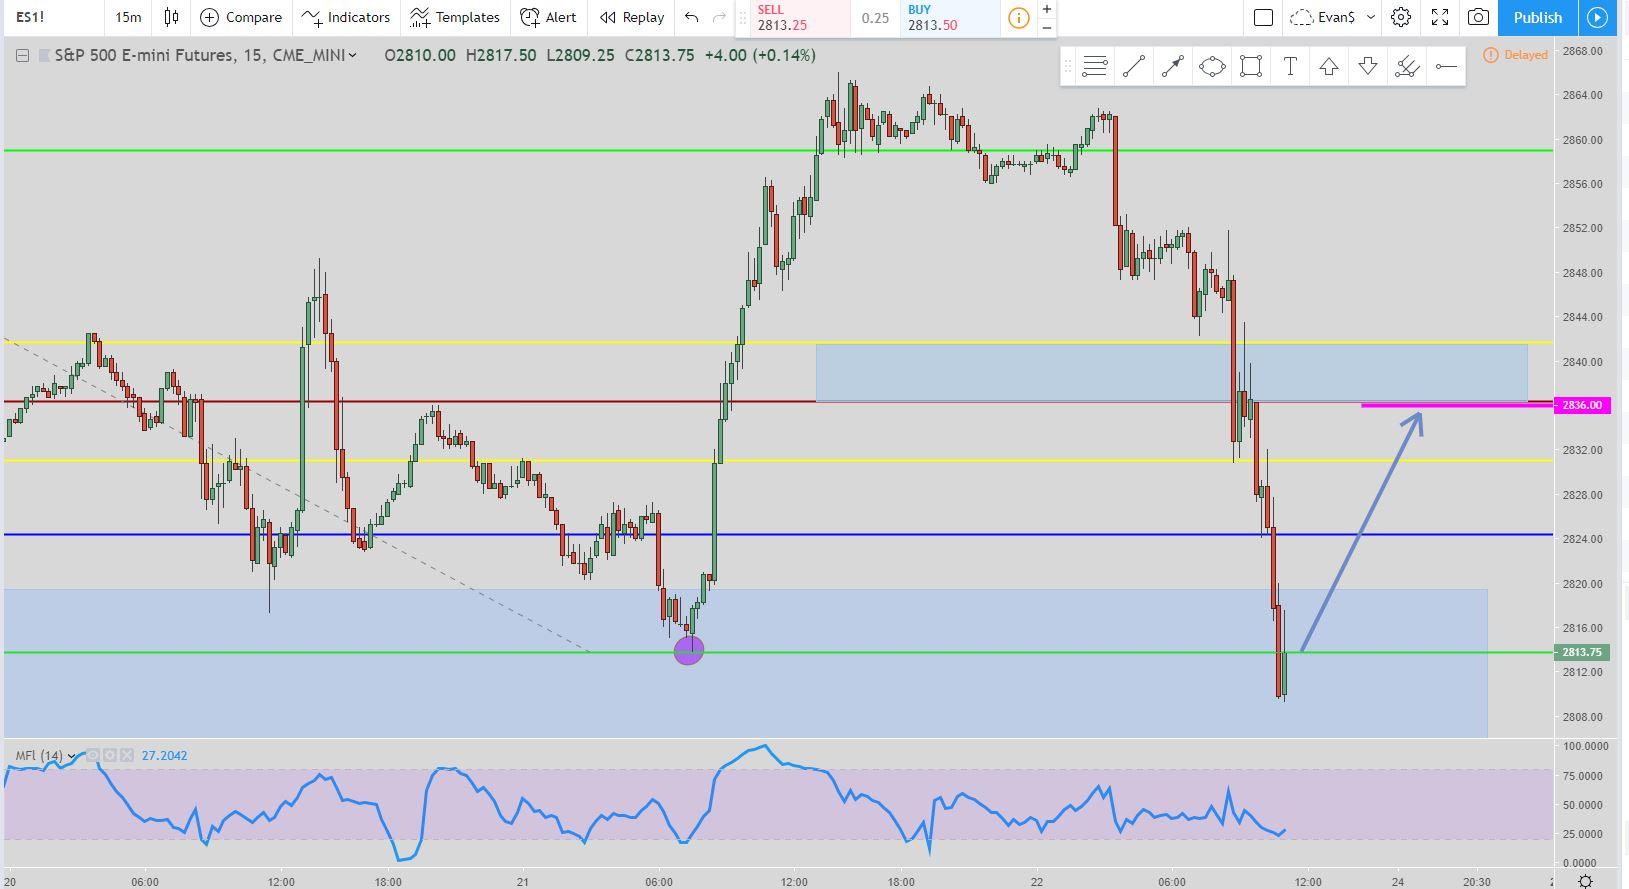
Price had initiated a Reverse Lightning Trade setup but the price went all the way back down to the previous pivot point low. When this happens you can see with the arrow and the pink line where the exit is located.
S&P 500 Chart
From the video below you can see the S&P 500 isn’t in dire straights at all if you are a bull. The 1-hour and Daily chart still need more pullback for the price to get close to the 38% Fibonacci retracement level.
Right now on the 15-minute chart, there is a good pullback happening so the price has hit the 38% Fibonacci retracement level that starts my 38-127 trade. The setups that have started to form on the 15-minute chart are shorts. The setup being used is the Reverse Lightning Trade. But one thing to keep in mind is we are still in some long setups, specifically the 38-127 trade on the 15-minute chart.
So next week it looks like we should see some good action both ways. The best thing to do is to take what the market gives you. If you feel the market is going lower then be patient and wait for better entries. There isn’t any reason to push anything, especially to the long side since price could easily retrace some more.
Video: S&P 500 Chart Technical Analysis for the Week of March 24, 2019
Popular Links
Here are a couple of links if you are looking at how I view the market and some trade setups. You can create your own trading style and setups. Quit paying losing traders to teach you. The only thing they teach is how to lose money.
Meditation:
https://evancarthey.com/how-to-become-a-profitable-trader-using-meditation/
How to scan for winning stocks
https://evancarthey.com/how-to-scan-for-winning-stocks/
My Robinhood Shameless Plug
If this post benefits you and if you haven’t used Robinhood for trading stocks but are thinking to then please consider using my referral link when you do sign up: http://share.robinhood.com/evanc203.
This way each of us will receive a free share of a random stock if you sign up through my referral link.
My Robinhood Review: https://evancarthey.com/review-robinhood-trading-service-with-no-fees-part-1/

