Should You Buy Nordstrom’s Stock (JWN) – They Just Beat Estimates
Nordstrom (JWN) reported today and they reported better than expected quarterly profit as customers bought more merchandise in its off price stores, sending its shared up more than 5 percent. https://finance.yahoo.com/news/nordstrom-profit-beats-wall-street-215839990.html
In the current day and age anytime you hear of a brick and mortar clothing store beating estimates in their quarterly report it raises some eyebrows in a good way. The Amazon effect has messed with just about every brick and mortar store in the US. Those that have adapted to online retailers have fared much better than those that have not. Nordstrom at first did not do a good job at this but they soon caught on and invested heavily in their online presence. Making it easier and much more accessible for their high end shoppers to buy their products online.
Apparently it has worked. If I owned a brick and mortar clothing company then I would try to duplicate the steps Nordstrom’s has done. Let’s look at the stock from a fundamental view based upon my markers and of course the technical setup.
Fundamental Analysis of Nordstrom
There are 7 fundamental markers I look for in a stock. I try to only purchase growth stocks so these are the parameters I look for to see if a stock meets the majority of the markers. I prefer to have all seven fulfilled. You can it more in depth here: https://evancarthey.com/how-to-scan-for-winning-stocks-an-insiders-view-to-my-process/
- Market Cap: > $300 million
- EPS growth past 5 years: >0%
- P/E: Over 10
- EPS growth next 5 years: >0%
- Sales growth past 5 years: Over 20%
- Debt/Equity: <0.1
- Sales growth qtr over qtr: Over 5%
Does Toll Brothers meet these 7 markers?
- Market Cap: 7.99B (YES)
- EPS growth past 5 years: -4.40% (NO)
- P/E: 15.96 YES
- EPS growth next 5 years: 8.87% (YES)
- Sales growth past 5 years: 5.00% (NO)
- Debt/Equity: 2.23 (NO)
- Sales growth qtr over qtr: 3.30% (NO)
I used Finviz.com for the fundamental analysis screener. With Nordstrom only hitting 3 out of the 7 markers I cannot pass this off as a growth stock. Two of the markers could be looked at further because obviously their past 5 years of sales have been hurt by online shopping (the Amazon effect). Since it looks like they have taken steps to become an online presence for online shoppers these are two markers I wouldn’t put as much weight in.
The Debt/Equity is a concern but I’m sure there is a reason it is that high. For the sake of what I look at I am not diving any deeper into it. Although the sales markers do not look good for Nordstrom’s I think it is a little misleading due to how this looks like a turn-around story now that they have their online shopping presence up to par.
Technical Analysis of Nordstrom
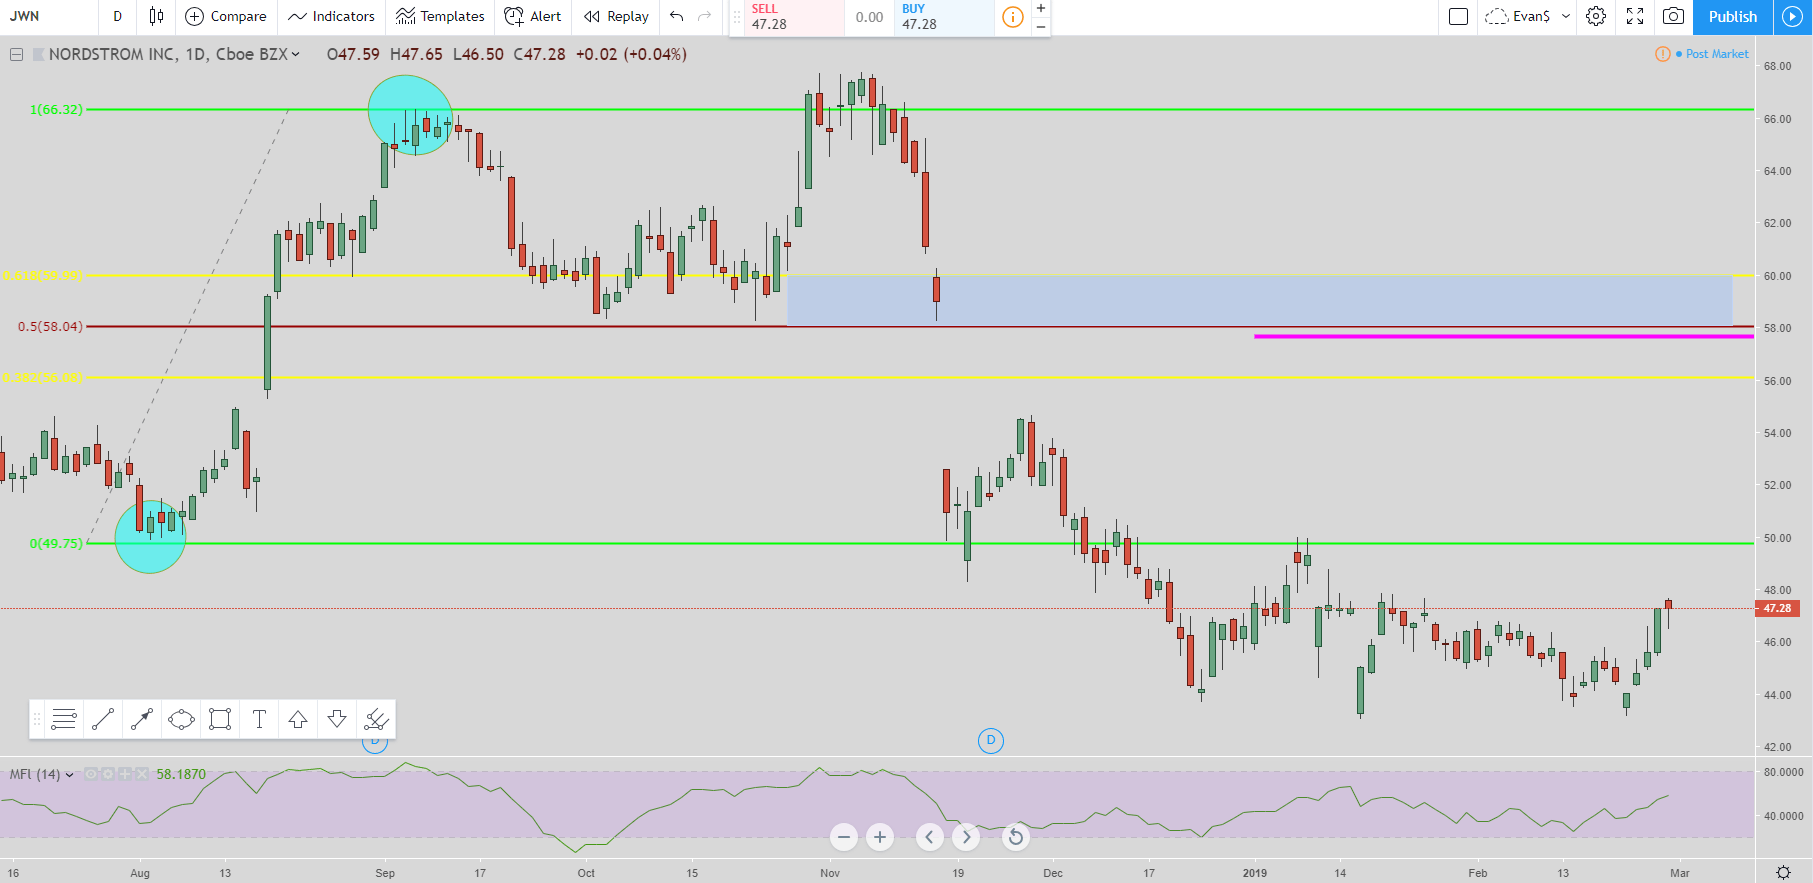
For the setup I am using my Lightning Trade setup and it is a buy setup. The teal circles are the pivot points I am using on the Daily time-frame chart.
You can see how price broke out and then made a big retracement down to the mid $40s. Price seems to have stabilized there.
The pink line is the exit and it is around $57.60. Even if price moves lower the exit does not go down. If you get in Nordstrom’s then you can get out whenever you want. But if the price moves lower than its current level of $47.28 then my Lightning Trade setup says you do not have to move the exit anymore.
With the exit being $57.60 and the current price being $47.28 there is some really good room for price to move up to. If I was strictly basing this stock on a technical analysis standpoint then it would be a screaming buy. If this was a Forex pair, cyrpto, or futures contract where there are not quarterly earning reports and fundamentals then I would buy this stock in a heartbeat.
But unfortunately fundamentals play a huge role in stocks (something I’ve learned the hard way).
The hard exit is at $58.04 so when price hits that level this long setup is over and time to look for another one.
Recap
For the fundamental side of Nordstrom’s I think it might be a little misleading. Even though they missed on 4 of the markers, 2 of them were for past growth and obviously they were hurt in the past by not having their online shopping up to par. That looks to have changed since they have invested heavily in it.
On the technical analysis side there is great room for a move up. If you believe in Nordstrom then it is a very good buy at this level. I do not own Nordstrom’s stock (JWM) and I do not have plans to purchase it in the next 48 hours. All information presented here is my own opinion and should not be taken as financial advice.
If this post benefits you and if you haven’t used Robinhood for trading stocks but are thinking to then please consider using my referral link when you do sign up: http://share.robinhood.com/evanc203.
This way each of us will receive a free share of a random stock if you sign up through my referral link.
My Robinhood Review: https://evancarthey.com/review-robinhood-trading-service-with-no-fees-part-1/
