Nvidia Corporation, commonly referred to as Nvidia, is an American technology company. In my world, they are best known for graphic cards for the computer gaming world and in recent years the mining craze for Bitcoin. This post, the NVDA stock prediction for 2020 will cover several time frames I use when looking to trade stocks.
Their stock in recent years have shown to reflect the success the company has had.
If you were long on it then look at how beautiful their chart looks:
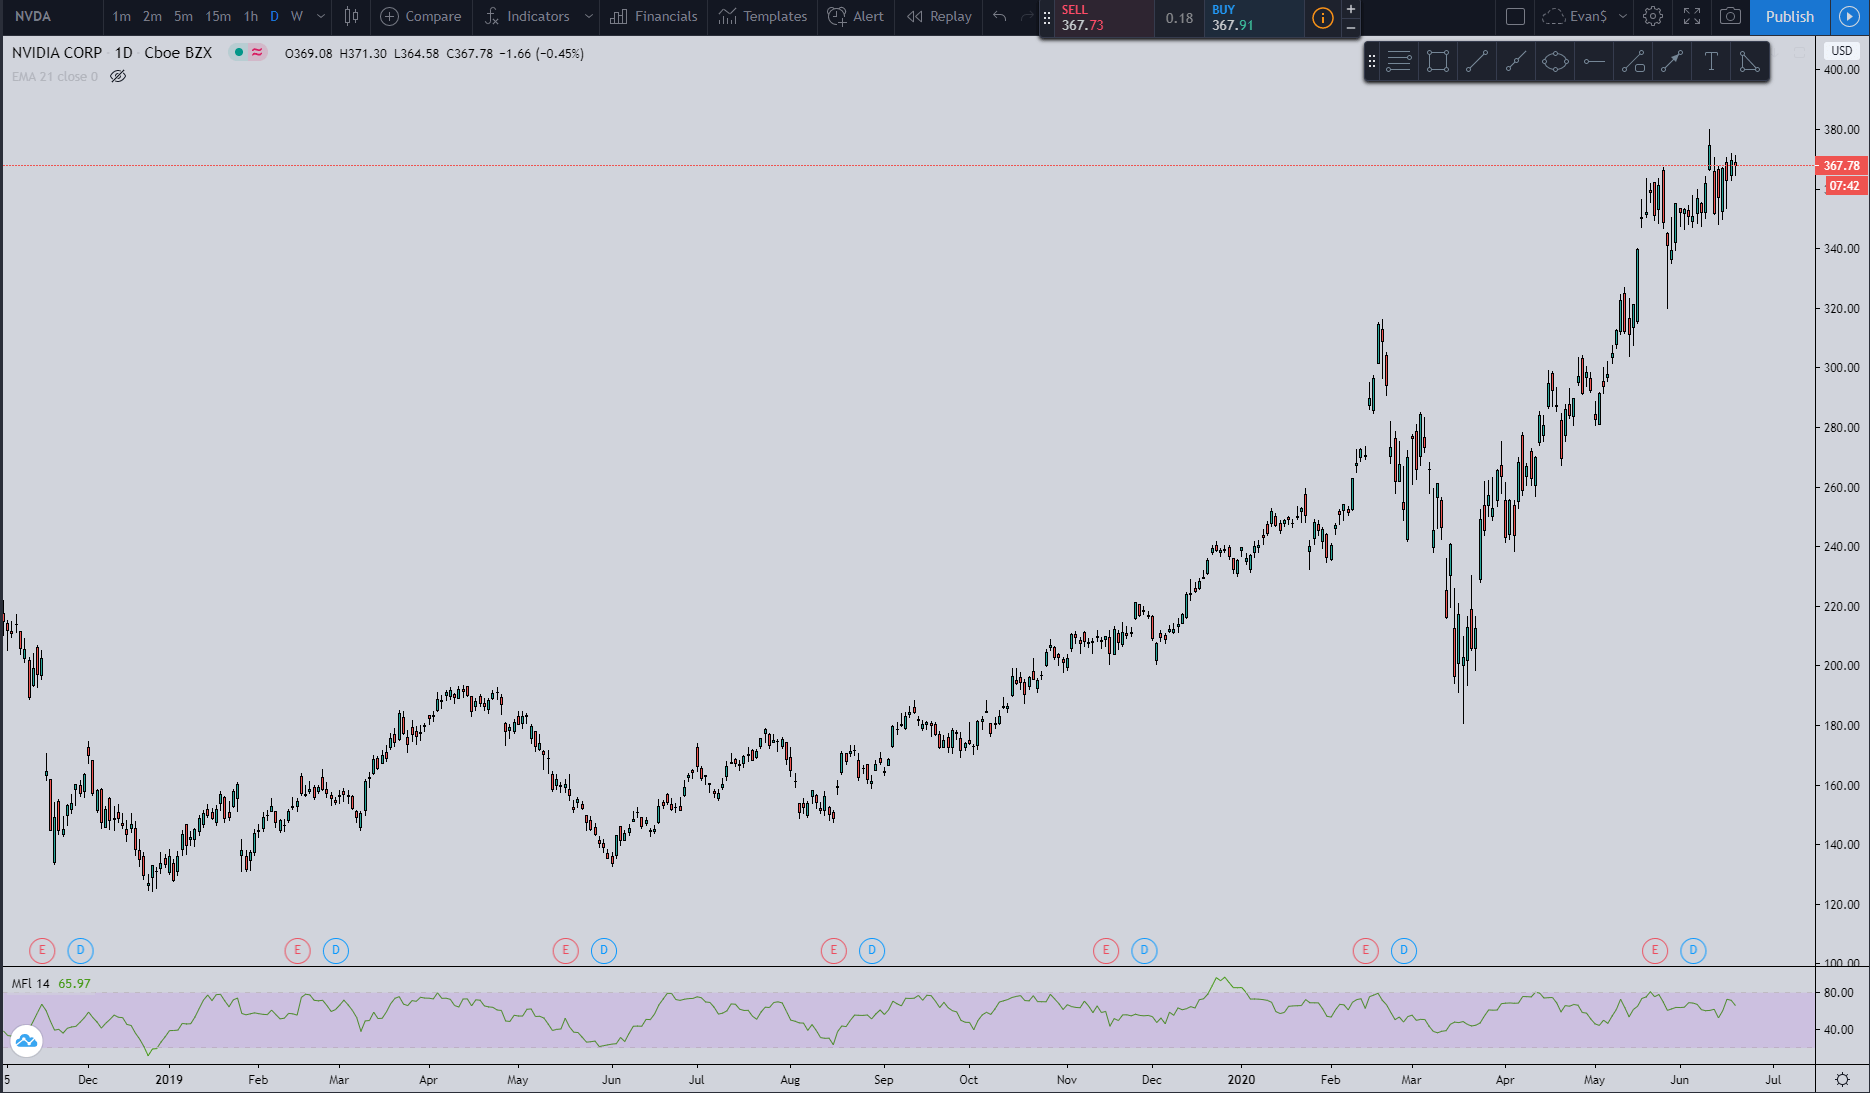
Just look at how it goes from the bottom left to the upper right in the past two years. For anyone who bought at just about any point the past two years then they should have made money.
A company’s stock chart you own doesn’t get much better than that for a long term sustainable trend.
But let’s see if this run-up could continue………..
NVIDIA Stock Price Target
Currently, for the NVDA stock prediction for 2020, it just hit a price target. Here is the picture below:

As you can see, the price from two weeks ago hit the target at around $369. But when one setup is complete then another one begins.

So using the weekly chart I am looking for a pullback. Assuming the pivot high of $379.66 holds then I am looking for a pullback to at least the 38.2% Fibonacci retracement line to around $303.50.
If that happens then the target I am looking for is the 127.2% Fibonacci extension level which is $433.88.
There are not any short setups present so there is nothing for me to cover from that front.
NVDA Stock – Buy or Sell?
There are numerous articles out there regarding Nvidia and where they think the stock is headed. Here are two of the top ones that came up:
https://financhill.com/stock-forecast/NVDA-stock-prediction
https://www.fool.com/investing/2020/03/01/where-will-nvidia-be-in-5-years.aspx
Everyone will have a different way of predicting where the stock is headed. What I am providing is the way I trade based upon my setups and how I look to trade.
As always I give price prediction targets and where I think the price of a stock is headed.
But with how I was fawning all over the stock earlier would I be a current buyer or seller of NVDA?
If I had to choose to buy or sell NVDA today as of 6/18/2020 then I would be a seller of the stock. I know that sounds surprising but here is why:
The reason why is the monthly time frame chart. Look at how the price of NVDA just hit the price target.

The price has hit squarely in the price target area I look for when I trade. This is using the monthly chart so it is over a time period of over 20 years.
This doesn’t mean that Nvidia won’t continue to move higher.
But from what I’ve seen when the price hits the target I use which is the 127.2% and 141% Fibonacci extension level then there usually seems to be some type of retracement which makes me very cautious where NVDA is at its current level.
With this being the monthly chart then the target that was just hit carries a very heavyweight. I do expect there to be some type of pullback to come from the target area of $372 to $414.
So if I personally had a good size gain in NVDA then I would look to take some of the profits off the table because I do expect there to be a pullback to come eventually.
This trade setup is the main one I use to trade. It is basically an ABCD setup but I’ve adapted it to fit my trading style.
NVDA Stock Prediction Video Review
Here is a quick video I did that covers the technical analysis that may be easier to look at than having to scroll up and down on the page.
NVDA News
If you are looking for further news on Nvidia’s stock then here are a couple of news outlets:
https://www.marketwatch.com/investing/stock/nvda
https://finance.yahoo.com/quote/NVDA
https://stocktwits.com/symbol/NVDA
Stocktwits is the one who is more of a community where people give their thoughts about the stock. Almost all of the views on Stocktwits are worthless but it can be good to check out if you are looking to see why a stock has taken a sudden move or what the general consensus seems to be after an earnings report. That is what I use it for.
The information on Stocktwits is faster than Marketwatch or Yahoo Finance.
NVDA Stock Prediction Conclusion
Overall, the technical setups I trade with are showing Nvidia to have a pullback in its future. Especially in the monthly chart which is the strongest time frame I use.
If I am to trade this stock then I would be looking to wait for a pullback before even thinking about getting in.
I think they do have an excellent product (especially for graphic cards for gaming computers) but the technical setups I use to trade are showing that the prudent move is to wait for a pullback to at least $303 before thinking about buying shares of the stock.
If you are looking for a super long term prediction then look at this chart:

If the current pivot point high of $380 holds then the pullback from the monthly setup I am looking for is $282. That is the new monthly long setup.
The target would be $449 as long as the current pivot point high of $380 remains in place and the 38.2% Fibonacci retracement level of $282 is hit.

