In part 4 of my Fibonacci Extension Bread and Butter Trade I will be talking about how I use the pivot points to draw the extensions. Recently I have made a slight adjustment to how I use the pivot point levels but it mainly has to do with the trend-lines. I had been looking for a way to get in at better price points rather than blindly entering into trades at Fibonacci extension levels. Through the use of trend-lines I have found a solution to that. It doesn’t get me in at the exact top or bottom. But it filters out the entries where I would get in much too early. I will talk about the trend lines in an updated post for Part 2 that I did awhile back for entries.
My Robinhood Referral
If this article helps you and you are thinking about signing up for Robinhood’s trading service then please use my referral link so we each will receive a free share of a stock: http://share.robinhood.com/evanc203
My Robinhood Review: https://evancarthey.com/review-robinhood-trading-service-with-no-fees-part-1/
The Way I Draw the Fib Extensions from the Pivot Points
The standard 3 pivot points I use to draw the Fib extensions are the 3 connecting pivot points. One thing to note is that after price goes past the top/bottom pivot point then that is the level to use.
One key point to remember is I am only using the 3 pivot points where there is a retracement of at least 50%. If price doesn’t hit the 50% retracement line then I do not use those pivot points. The reason why is I have seen price sky-rocket one way or the other from shallow retracements from the 23.6% or 38%. The 50% signals there is some momentum going your direction.
The other way I draw the Fib extensions is from the reverse pivot points. Now I doubt that is an accurate way to describe it so luckily we have an invention called “pictures” that will help smooth my deficiency with descriptions. The charts in this post will help clarify what I am referring to in my pivot points. This isn’t the majority of the way I draw them. I like to have a 50% retracement and you don’t really have that in the reverse pivot point drawing. But it something I wanted to throw out there because I do draw them this way from time to time.
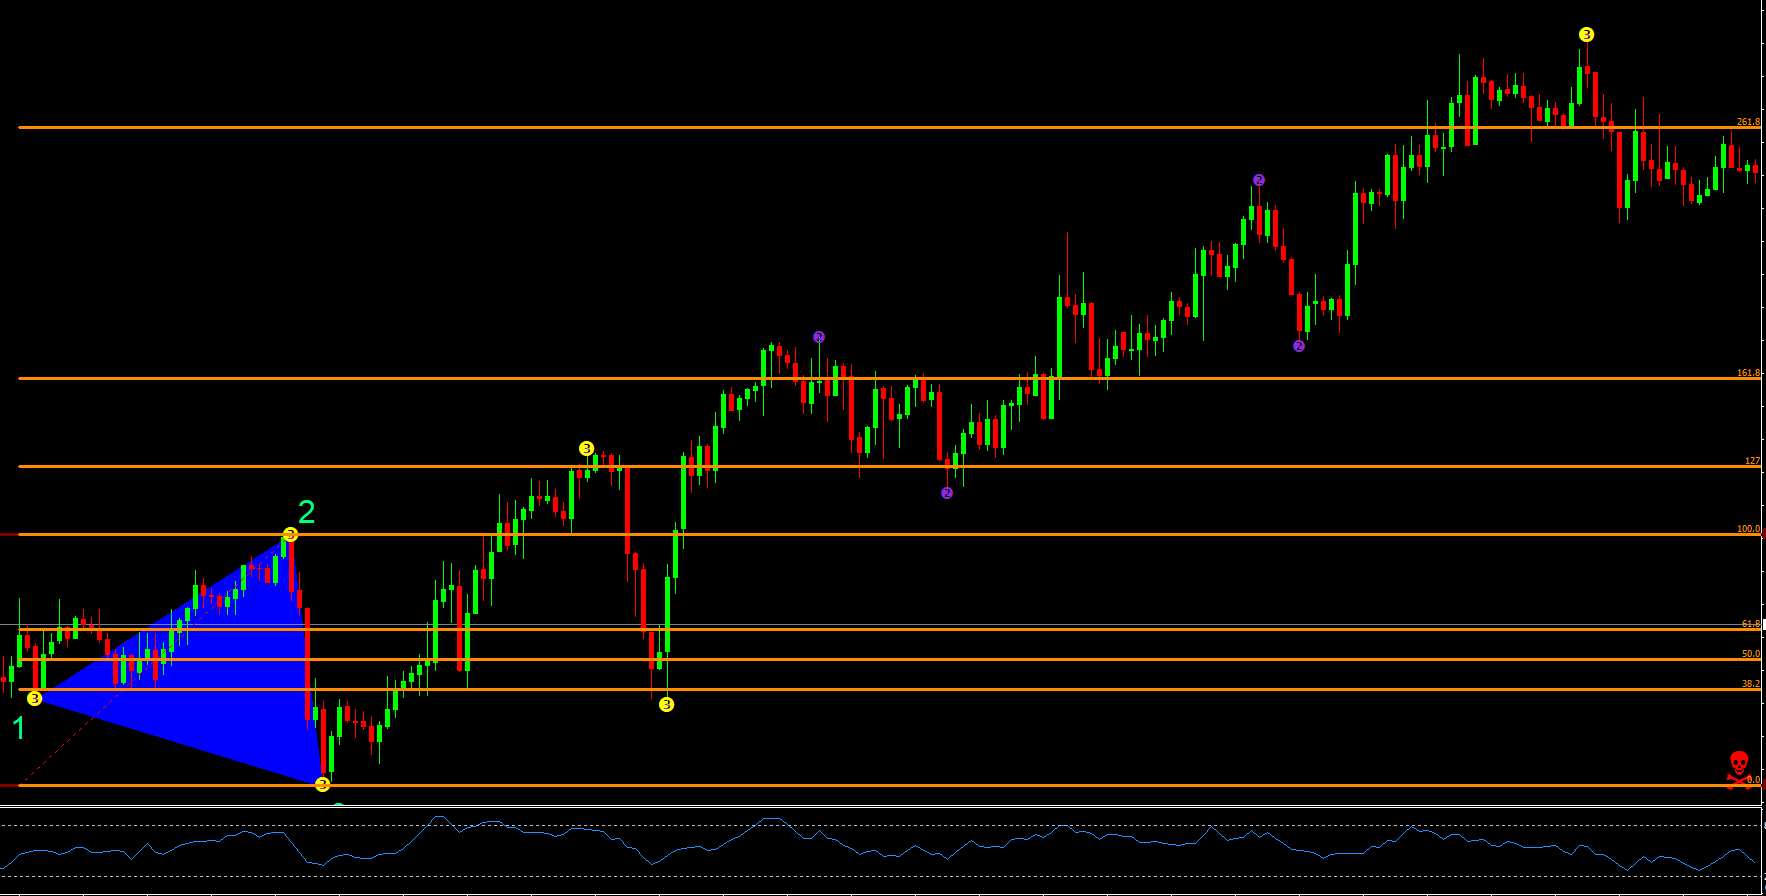
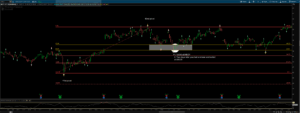
Chart Examples – Standard Pivot Points
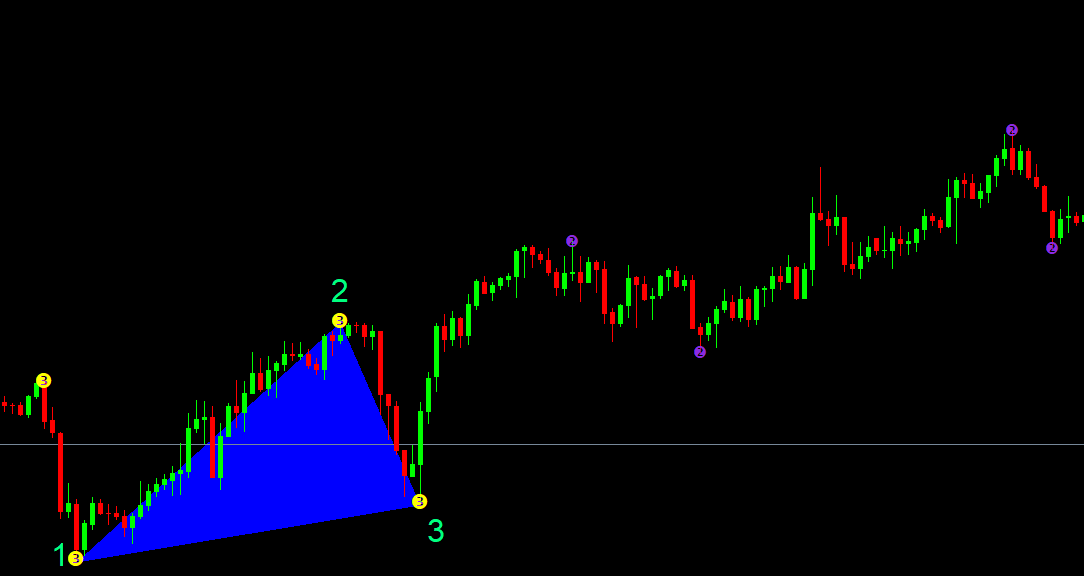
Here you can see the standard pivots I use for drawing the moves. I labeled them “1-2-3.” First you have the low, then you have the high, finally you have a lower high.
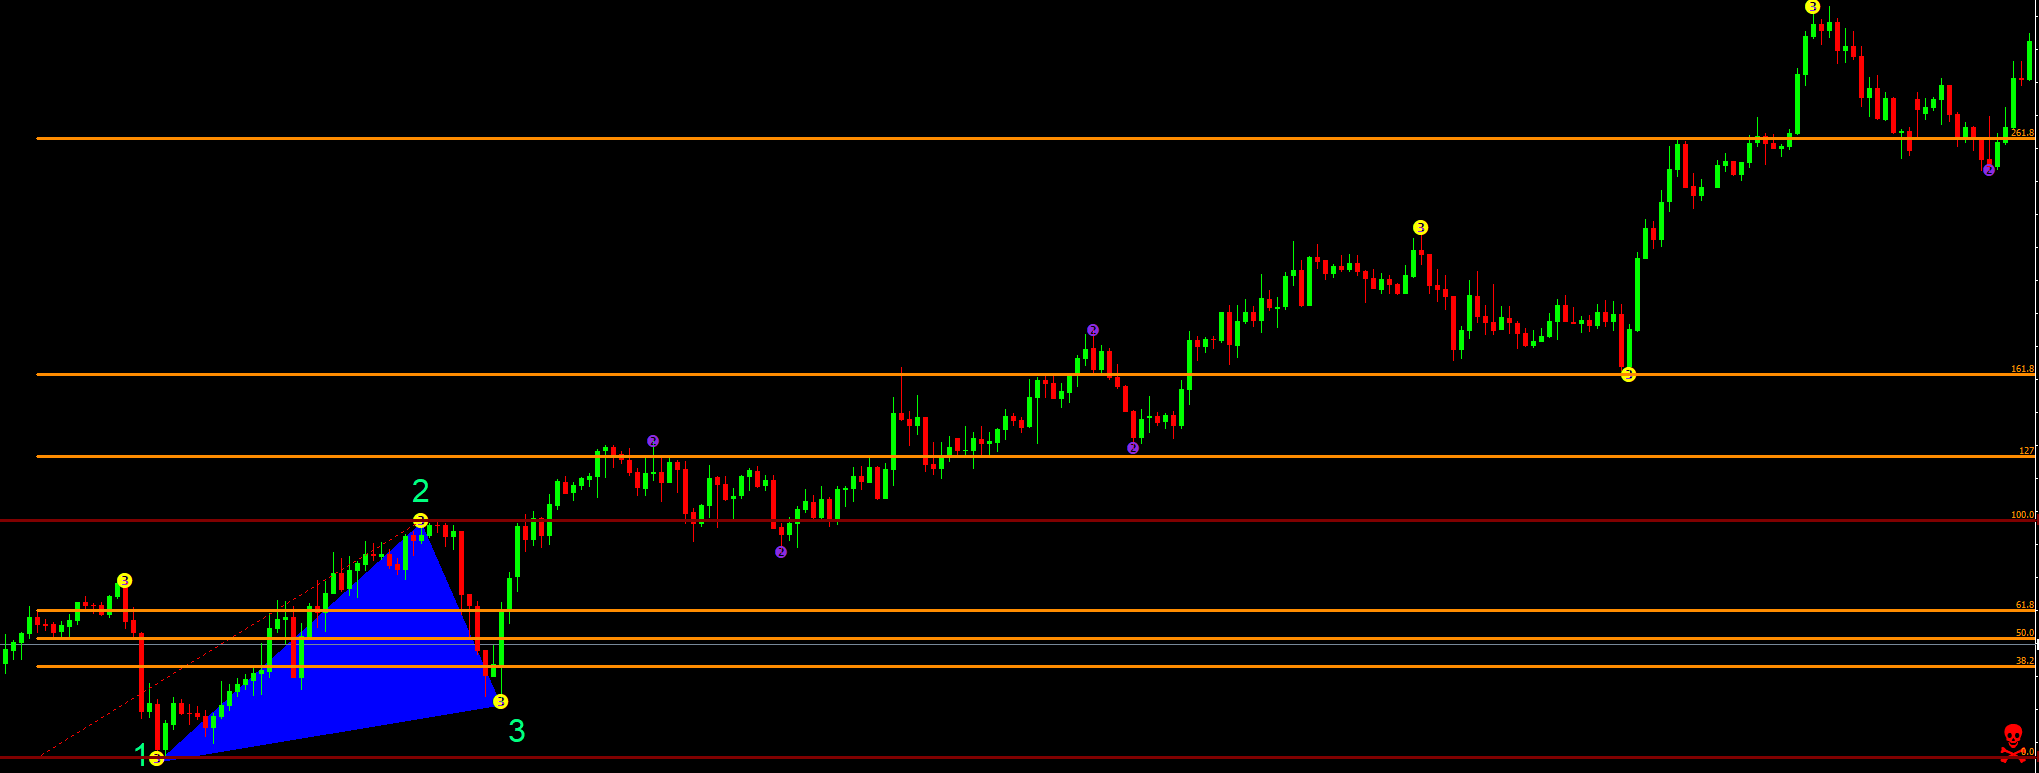
You draw the Fib extensions from 1-2 or 2-1. It just depends on how you have your settings setup in the Fibonacci tool. I also like to put a horizontal line between the 1st and 2nd pivot points since I can line up the Fib extension and retracement tool accurately.
If price comes back and hits the 50% Fibonacci retracement then the move is done after breaking the pivot point high/low. It doesn’t matter if price has gone up one pip/point/cent past the pivot point high/low. If price does and then retraces to the 50% Fib retracement level then that move is over. I am then looking for the next move.
Chart Examples – Reverse Pivot Points
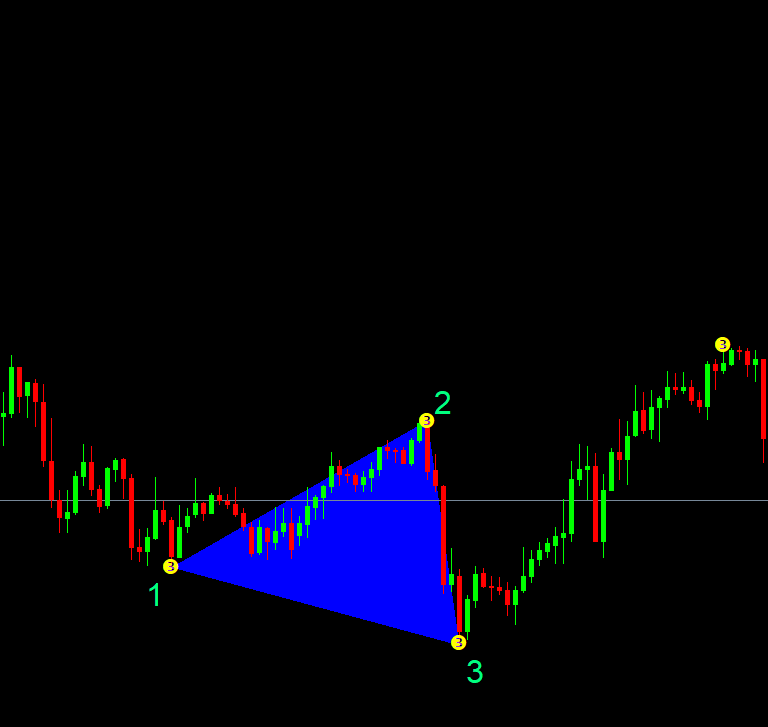
Here you can see how point 3 goes lower than point 1. When this happens I draw the Fib extensions from 2-3 or 3-2 depending on how you have you Fib extension tool setup.
The times I use the reverse pivots are usually at tops or bottoms. What I have seen is the reverse pivots happen when there is a trend change. Now, this doesn’t happen every time but this is usually when I see it form.
Conclusion
The major point to drive how is that when the price comes back to take out the Fibonacci retracement at 50% then the move is over. I don’t continue to use the pivot points that created the move. So once the pivot points are set. Price exceeds the pivot points and starts hitting the extensions. Then price retraces and hits the 50% Fib retracement level the move is over. On to the next pivot points with the Fibonacci extensions.
It doesn’t matter how you get your pivot points. I use the “3_Level_Semafor_ZZ” indicator that I found for free for Meta Trader 4. Since then I paid programmers to convert it to be able to be used in Ninja Trader, Meta Trader 5, and Think or Swim. It labels the pivot points easily for me. You can use whatever you want to use but I have found that is what works best for my trading style.
Parts 1 -3
Here are parts 1-3 for my Bread and Butter Fibonacci Trade:
