If you want to make money trading Fossil (FOSL) then read on. Earlier in the year I posted two articles that it wasn’t too late to buy Fossil. Since then FOSL ran up to around $32 and has recently retraced to around $22. Today I started a small position and am looking to buy more if the price continues to go lower that I will talk about in this post.
February 15, 2018: Fossil (FOSL) Just reported massive earnings and there is still time to get in
January 4, 2018: Fossil (FOSL) May be coming back from extinction
[mc4wp_form id=”1229″]
The Big Picture of Fossil (FOSL)
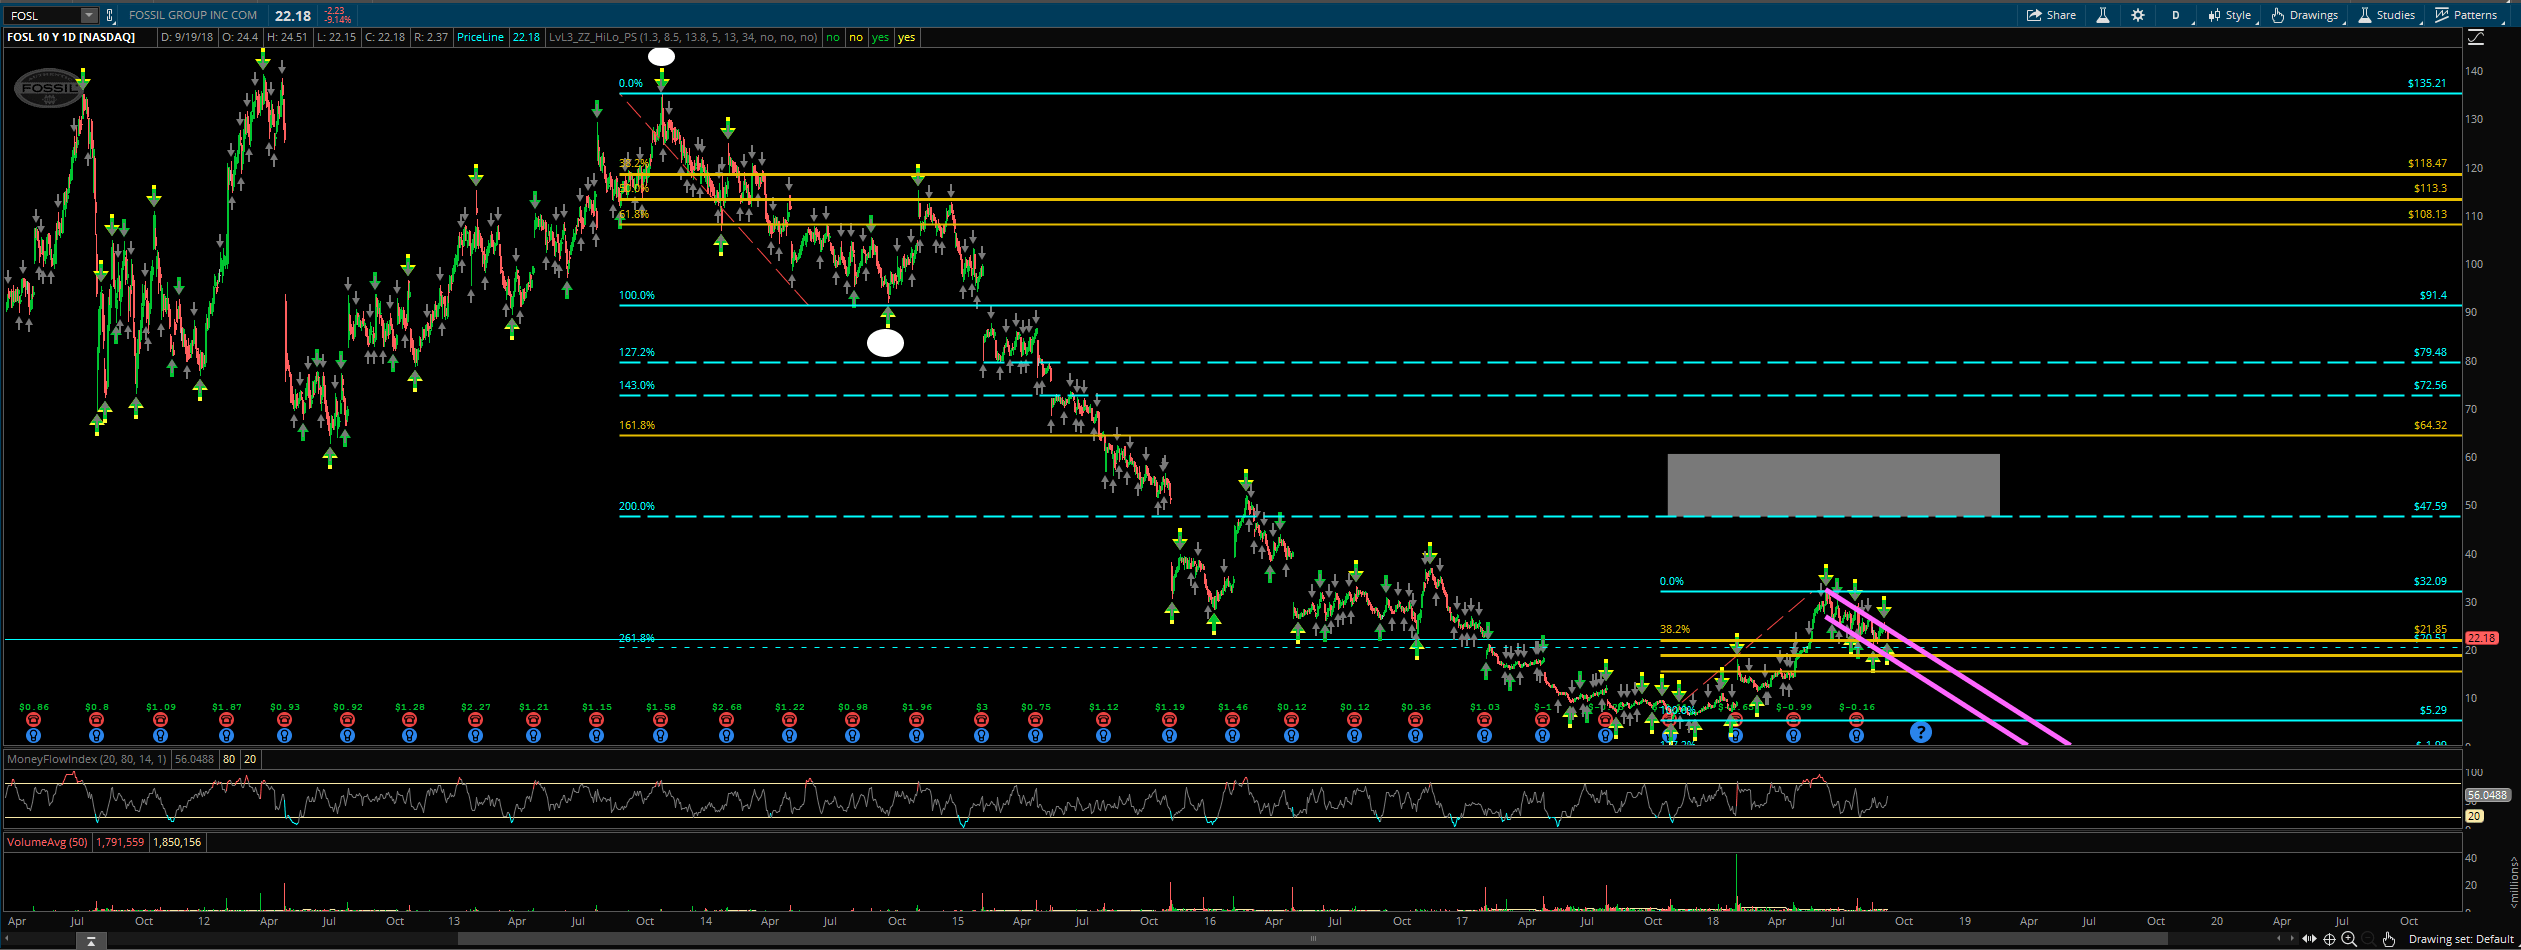
Here you can see the big picture of Fossil. From November 2013 to November 2017 it has been pretty much all straight down. When I first got in I was using my Bread and Butter Trading Style. I still use it from time to time but a new setup I found works with Fossil as well. In fact the exit points are remarkably similar. For the Bread and butter trade the exit is near the top of the gray box which would be around $60. My new trade setup the exit is the 161% Fibonacci Extension level at around $64. I need to do a post about my new trade setup I primarily use.
With such a huge drop in price having these two setups have the final exit for a long position is crazy. When I was in Fossil previously my cost basis was around $11. I sold at around $30 because it was a huge gain and I told myself I could always get back in if I wanted to. Well now I want to.
The Bull Flag
For the most part I don’t worry about candlestick or chart patterns. I think they are extremely subjective to the eye of the beholder and are only clear after the fact where the money has been made. With that said I am going to totally contradict myself and say that I see a bull flag forming. Normally I wouldn’t care but since my final exit target is around $60-$64 then I think this is a great setup. Plus price has pulled back from the recent highs of $32.
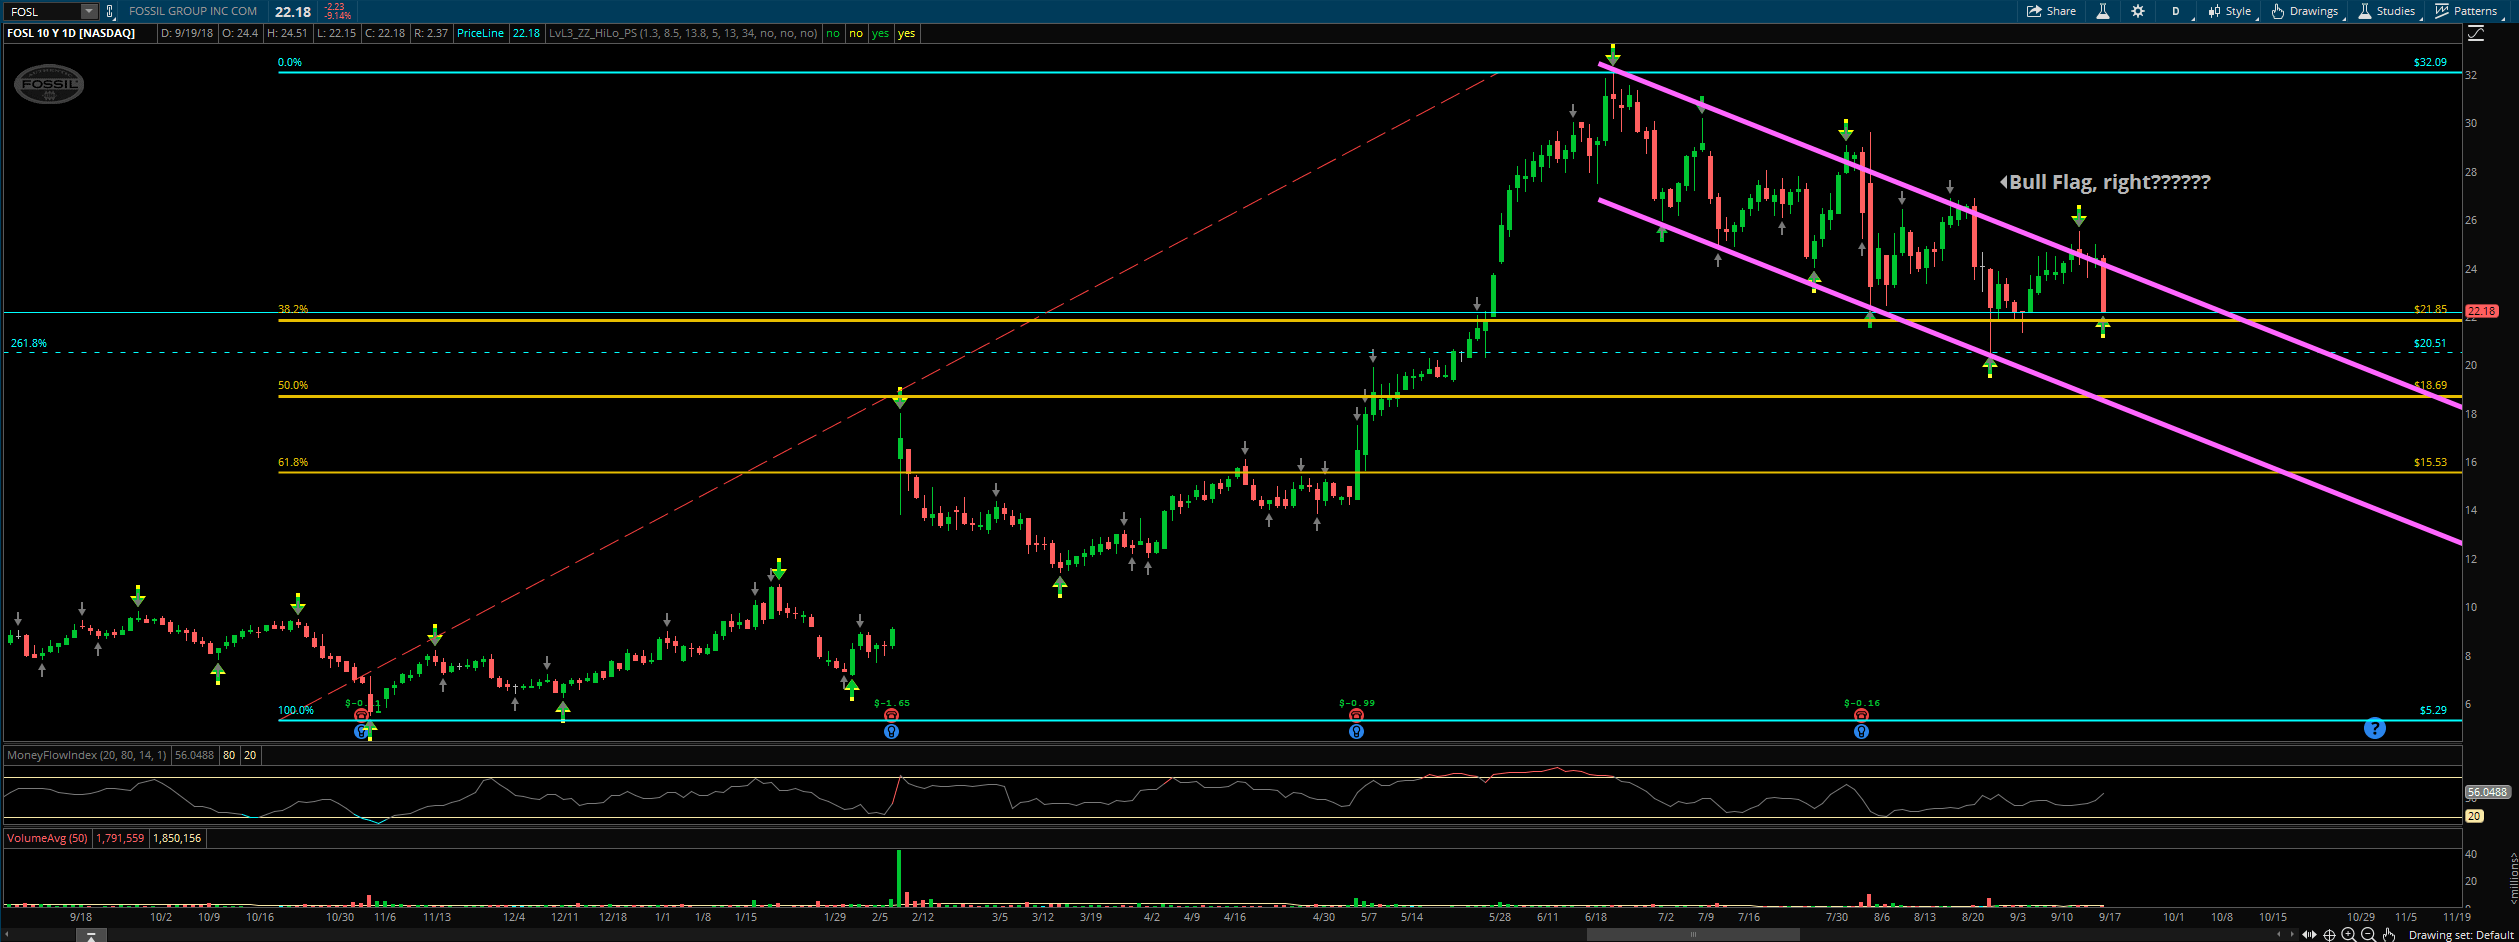
You can also see how price is hitting off of the 38% Fibonacci retracement level which is where I got in today. My next entry is around $19 which is just north of the 50% retracement. If price keeps on going lower from that then I’ll keep adding a little. I only put in about 20% of the money I will get long with today. Usually the stock goes the opposite way when I first get in which is why I never get in more than 50% of the money I plan to use for the stock.
So I say it is a bull flag that is forming. I also think price is still going to go lower, to around $19 but it may not. I don’t know which is why I got in a little today. The final exit is at $64 but I doubt I hold on to it that long, I seriously doubt it. It probably will take a couple of years to get there and this is a daily chart. I’ve been using the hourly chart for my trades because they move quicker and don’t tie up a trade for such a long time.
Final Verdict
I am long at around $22.30 and will buy more for sure around $19. If price keeps on going lower then I will keep on buying a little more. Probably $15.50 would be my next entry, not sure after that. But with my exit being $64 and what I see as a bull flag forming then I think this is a great spot to get in.
If bull flags do what my Google search results show that they do then price should explode upward out of this downtrend eventually. That’s about all I know about bull flags. The only reason why I brought it up was because price had pulled back and my final exit is around $64 (if I stay in that long which I seriously doubt). I was going over the stocks I follow and looking for new setups when the bull flag setup jumped out at me. Plus Fossil was down over 7% today which is something I always look for, beat up stocks to go long.


