Last week Bitcoin exceeded all of the buy setups I spoke about. Right now it looks like Bitcoin is consolidating a bit before it decides what it wants to do next. This post will be how to trade Bitcoin for the week of 5-20-2019: Buy or Sell? Here is last week’s post that showed the targets which were hit: https://evancarthey.com/bitcoin-has-created-a-new-long-setup/

Bitcoin short daily chartSince Bitcoin had a big run-up last week it is now hitting against resistance levels so short setups are the ones to look for. This doesn’t mean Bitcoin won’t continue to move up. It does mean there will be resistance and pullback along the way. It won’t be a straight shot up like last time it had its huge run-up.
You can see in the daily chart above the short setup that it is almost in. When the price hits the bottom pink line at 8530 (it is 8551 on the chart but that was the closest I could get it) then the trade begins. The exit is the bottom of the teal box. If the price goes up and hits 9733 (2nd pink line) then the exit moves to the bottom of the green box at 8534. Finally, if the price goes up and hits the top pink line at 11728 before hitting the other exits then the exit moves to the bottom of the blue box at 9766.
If any exit is hit along the way before an entry is hit then the move is over. You remove all entries and don’t continue to get in once an exit is hit.
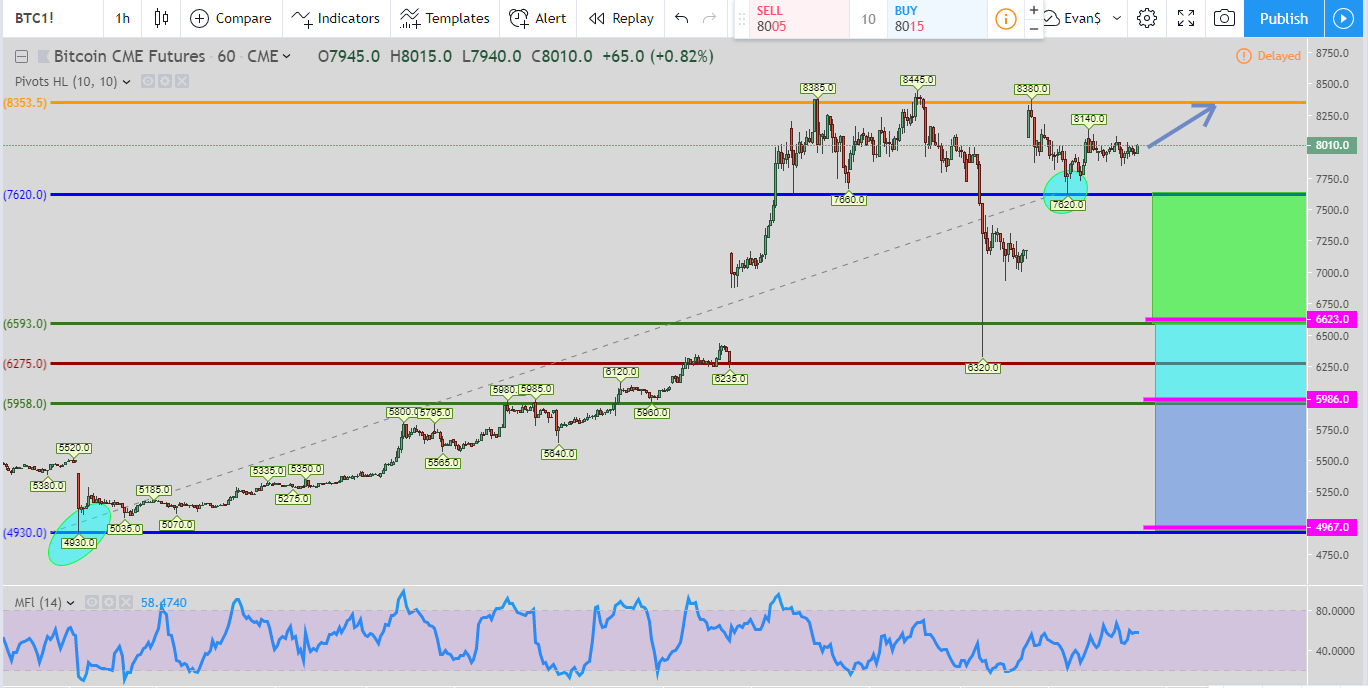
In the 1-hour chart we are waiting for 2 things to happen before the trade can begin. 1st we need the price to go up and hit the orange line at 8353. Once it does that then we can look for the 61B long setup. The entries are the pink lines and the exits are at the top of each box’s respective colors. Same rules apply where if an exit is hit then the move is over and do not get in at the other entries.
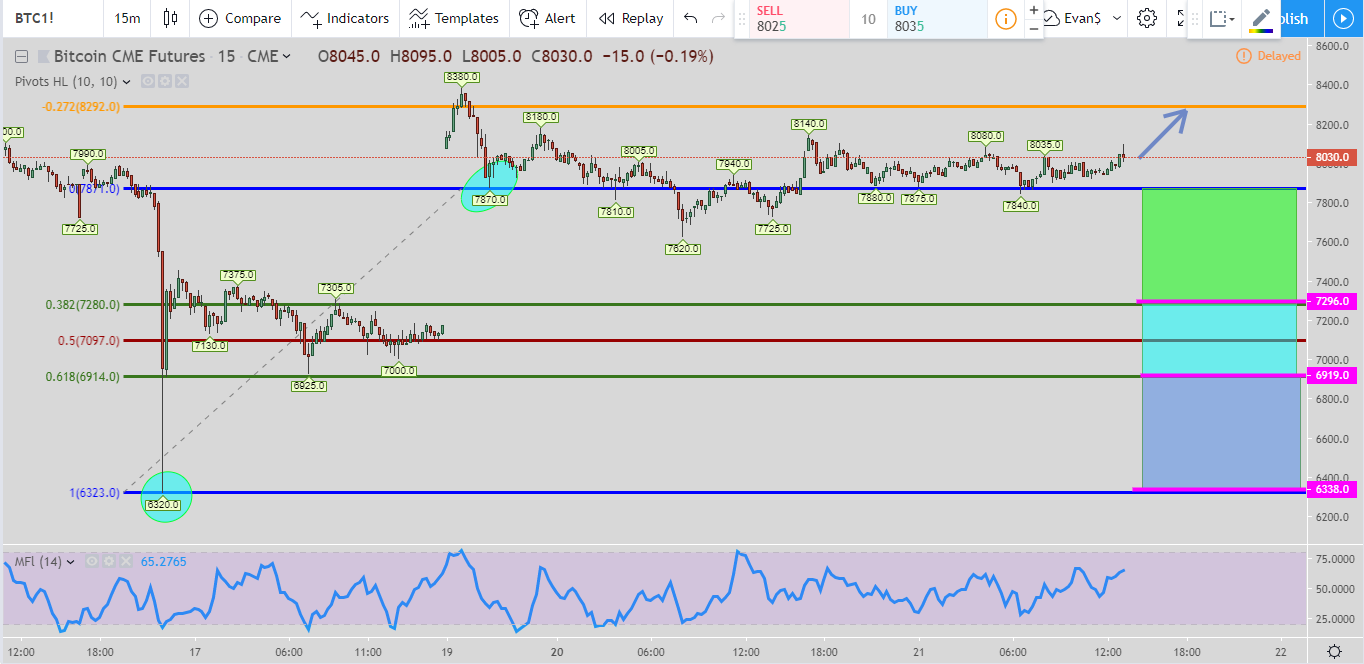
The 15-minute chart is waiting on the same setup as the 1-hour chart. It is my 61B long setup. Wait for price to hit the orange line first and then we can look for the longs at the pink lines. Same exits apply as the 1-hour rules.
Conclusions on How to Trade Bitcoin for the Week of 5-20-2019: Buy or Sell?
Overall I am looking for Bitcoin to hit some snags on its rise up. If it does continue to rise then we’ll definitely see some good volatility as it works its way past some pivot points. This will create plenty of short term long setups to take advantage of. I really do not see Bitcoin making the huge rise it had before now that hedge funds and institutions are involved.
If it does get back up to the $20,000 level then look for lots of fake outs on its way up.
Popular Links
Here are a couple of links if you are looking at how I view the market and some trade setups. You can create your own trading style and setups. Quit paying losing traders to teach you. The only thing they teach is how to lose money.
Robinhood Trading Broker
If this post benefits you and if you haven’t used Robinhood for trading stocks but are thinking to then please consider using my referral link when you do sign up: http://share.robinhood.com/evanc203.
This way each of us will receive a free share of a random stock if you sign up through my referral link.
My Robinhood Review: https://evancarthey.com/review-robinhood-trading-service-with-no-fees-part-1/

