Bitcoin this year has seen a revival. For my Bitcoin price prediction we are going to look at the charts from several time frames to see how they align. Since the lows early in 2019 of around $3,300, Bitcoin has peaked at a little over $14,000. The good times are back! Right?
When Bitcoin was plunging lower a lot of people were saying that Bitcoin was done and over. But it has now risen and most people are back on board declaring it to be hitting $100,000 next stop! Based upon what I see in the charts, the odds of it hitting $100,000 in this move are very slim. Now that doesn’t mean it will never hit $100,000. But in this current move it is literally going to have to keep on going straight up in order to reach that target.
In this post you’ll see why my bitcoin price prediction for 2019 has it making a retracement first. Then if it is going to get setup for another big move up it will happen after the next retracement.
Bitcoin Prediction
For the Bitcoin price prediction we will look at the 4-hour, Daily, Weekly, and Monthly chart time-frames. Some will have more information than others. The goal will be to tie all of them together to give us an accurate picture of what we can anticipate for the next 5 or so months.
4-Hour Chart
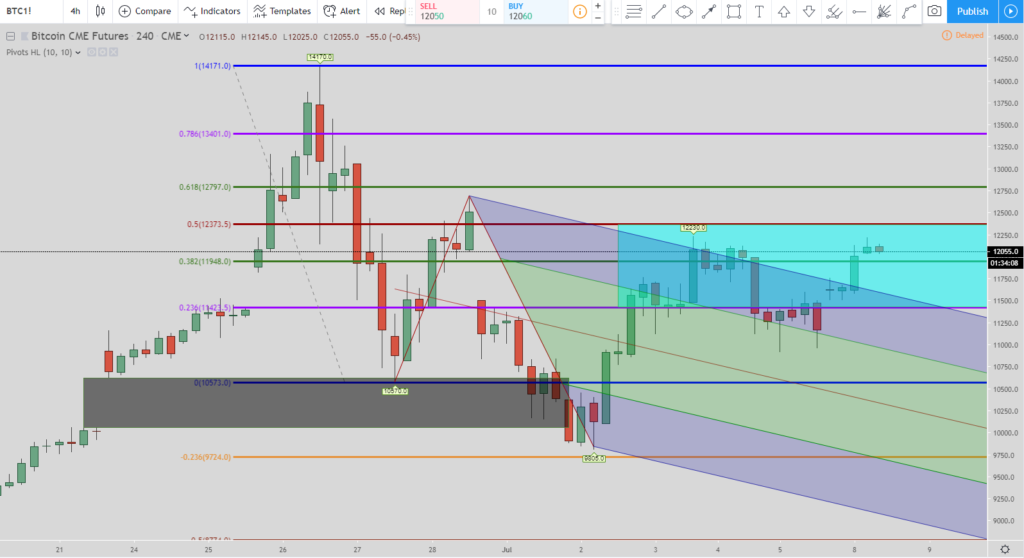
In the chart above it may look like the chart is a mess but have patience and let me explain.
The black box at the bottom shows the gap that has now been filled from the past move down.
The Schiff pitchfork is on there to show when price closed above the media line (the red diagonal line) that you could go long at that point. Let me remove it and show you the updated chart without that included since we don’t need it anymore.
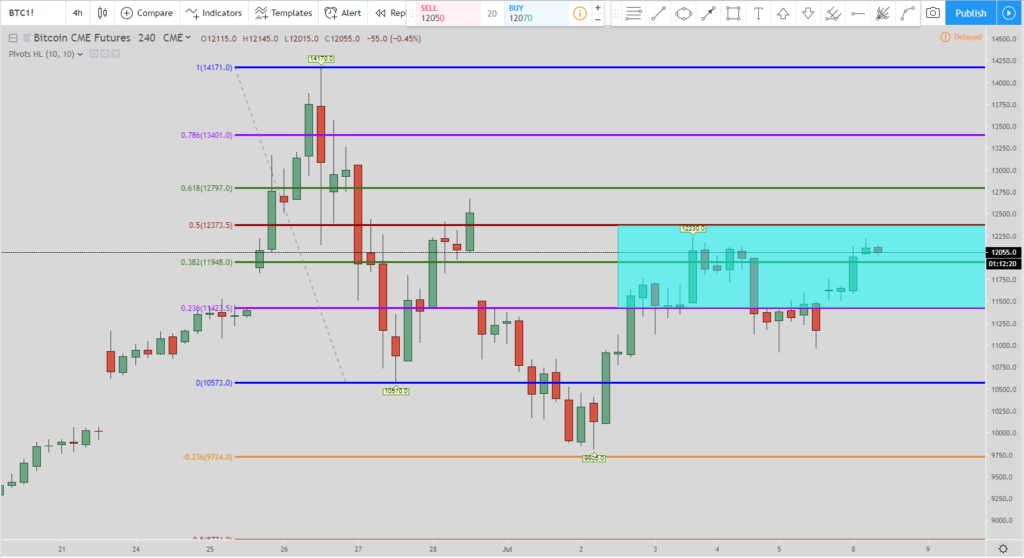
In the chart above I removed the Schiff pitchfork and the black box showing the gap being filled.
The current target for the exit we are looking for is at the 50% Fibonacci retracement level. That is the top of the teal box around $12,363. As you can see the price is very close to hitting it. Once it does then this long setup will be completed.
Daily Chart
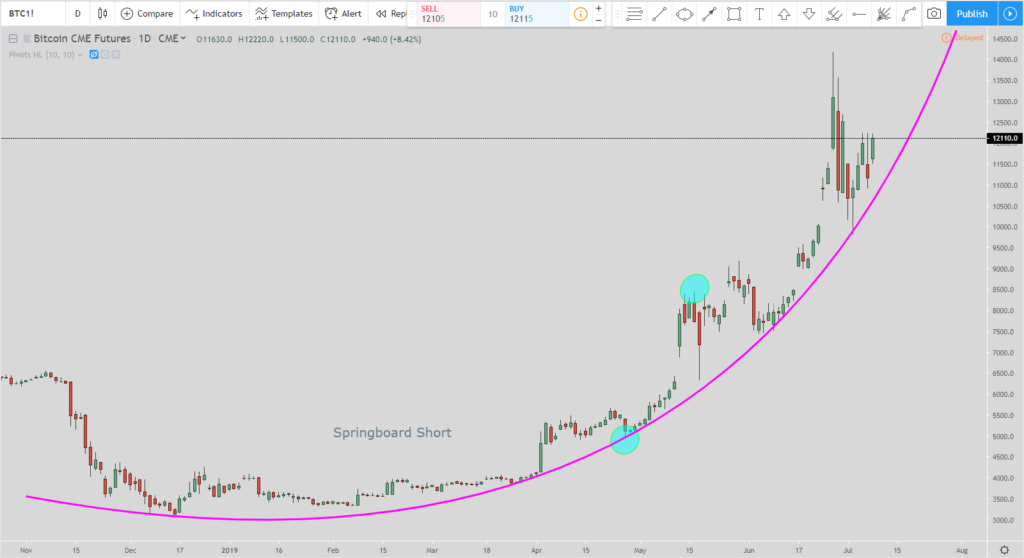
The first picture in the daily chart shows Bitcoin in a very nice parabolic curve (the pink line). As long as the price stays to the left of the pink line then the trend is up. But what happens if the price closes below the parabolic curve? Let’s look at the levels to look for in the charts below.
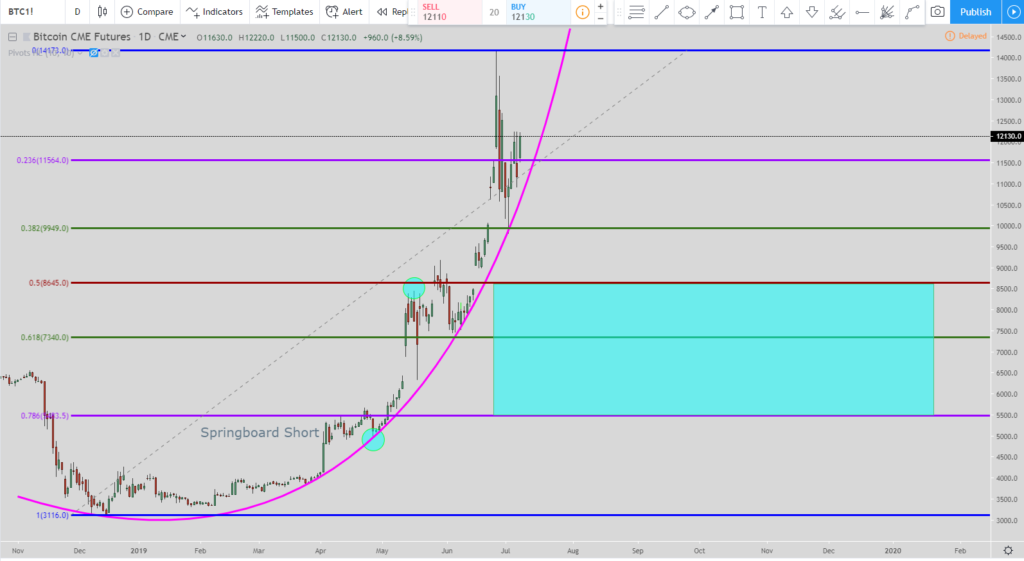
When a parabolic curve breaks there are two main targets to look for. The first is the 50% Fibonacci retracement level and the second is the 78.6% level. The top of the teal box is the 50% level at around $8,645 and the 78.6% level is the bottom of the teal box around $5,498.
The 78.6% area doesn’t have to be hit but I would definitely look for the 50% retracement level to be hit. Traditionally when a parabolic curve breaks the drop is pretty fast. So when the price closes below the curve then be very careful.
If the current swing high of $14,170 holds then this Fibonacci retracement chart is live. But if the price closes to the right side of the parabolic curve then look out! Because the retracement could be underway. Here is a picture I love that shows the emotions in a parabolic curve:
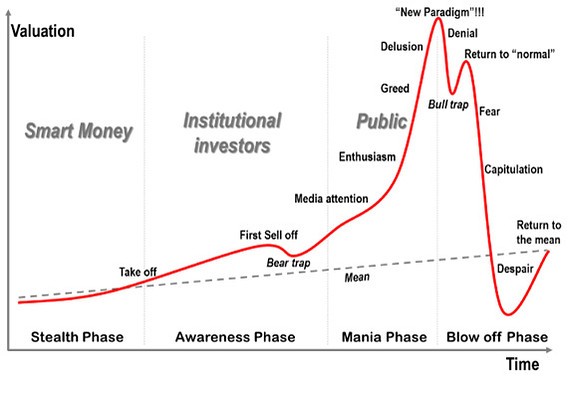
If we are in the “Greed” or “Delusion” stage then the correction is right around the corner. So my warning is to be very careful once the parabolic curve is broken. Right now it seems to be find if you are in Bitcoin as long as the price stays to the left side of the parabolic curve.
Weekly Chart
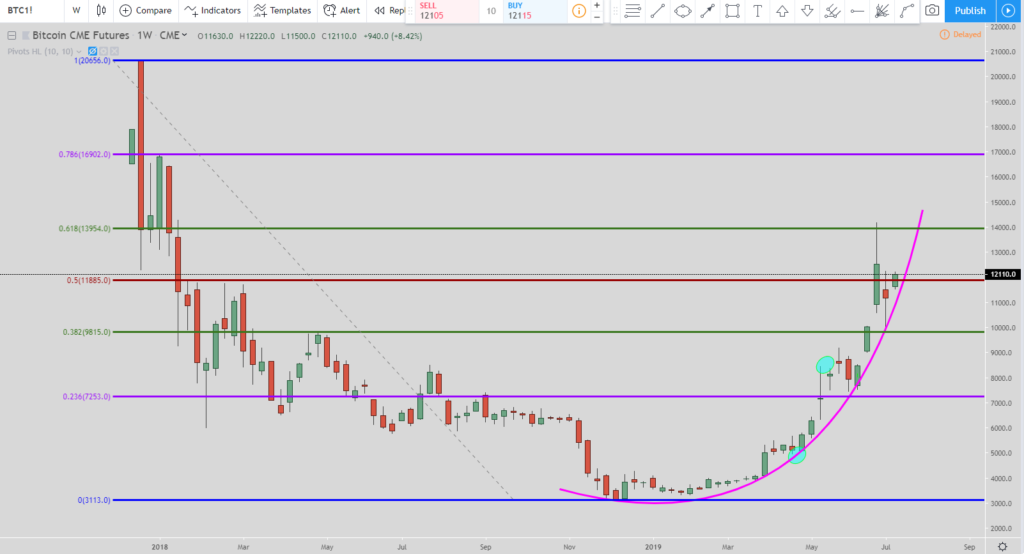
In the weekly chart above you can see the rise with the parabolic curve still attached. I added the Fibonacci retracement from its last high of around $20,000 to show what is happening at the different retracement levels.
You can see how the price ticked off of the 61.8% Fibonacci retracement level and has stalled price out there. In the next couple of weeks if the price doesn’t resume its move back up then the parabolic curve will be broken and the retracement will have started.
Monthly Chart
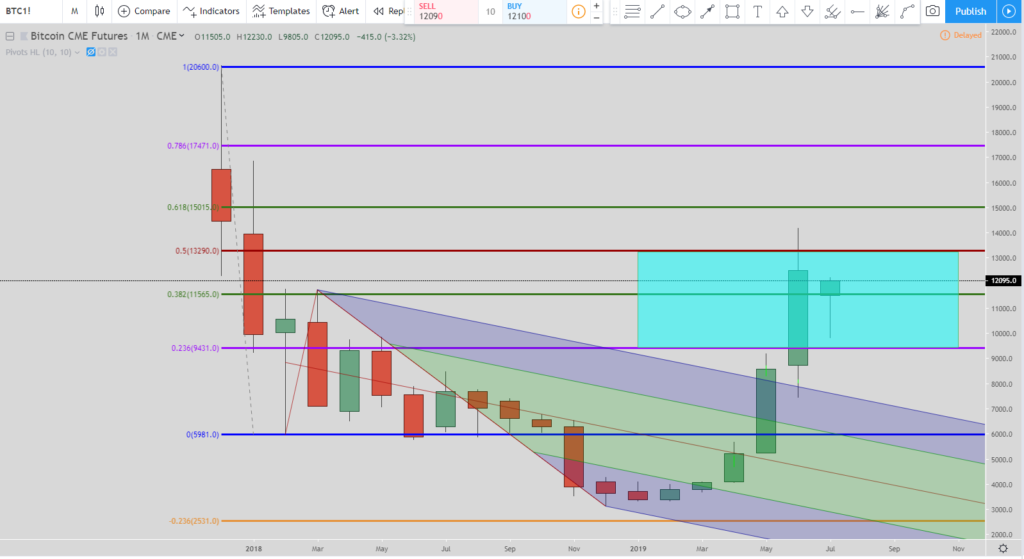
The setup here is what I call the Springboard Reversal Long. As you can see from the chart the price did not go down and hit the 123.6% Fibonacci extension line (orange line). Then price rose up and closed above the median line for the Schiff Pitchfork.
To initiate a buy the price has to either close above the median line of the Schiff pitchfork or retrace to the 23.6% Fibonacci retracement level. I prefer to have both of them before entering a trade.
Once the price did this then the target is the 50% Fibonacci retracement line which is the top of the teal box. As you can see the price hit it last month to complete the trade. Since this bullish setup is complete then that is an indication that we may be in a holding pattern or setting up Bitcoin for a retracement.
It is very interesting this setup was complete last week and the price of Bitcoin is starting to getting close to breaking the parabolic curve from the other time frames I talked about previously.
Video for My Charts
In the video I go over in detail from the charts I went over above. Plus as a bonus and a thank you for watching the video there is a bonus. In the 4-hour chart, I show a new short setup that just happened. The long setup that I mentioned in this post just completed but that created a new short setup.
What is the Future for Bitcoin?
Some people believe Bitcoin is here to stay while others think it will one day be worth nothing. There are many people on each side of the coin who are equally adamant they are correct. Edward Snowden believes cryptocurrency is here to stay but Bitcoin won’t be the coin that becomes the dominant cryptocurrency: https://www.ccn.com/bitcoin-wont-last-but-crypto-is-here-to-stay-edward-snowden/.
Jeff Sprecher who is the NYSE’s chairman says Bitcoin is here to stay: https://www.forbes.com/sites/billybambrough/2018/11/29/bitcoin-is-here-to-stay-says-wall-street-boss-amid-crypto-rout/#18fbcb924fbf
“Often times in finance, it’s not about being the best — it turns out to be about being the broadest and the most commonly accepted and for whatever reason bitcoin has become that.”
Personally, I am more of the belief to what Edward Snowden believes in his article above. Cryptocurrency is here to stay but once the dust settles it may not be Bitcoin that is the dominant crypto currency. If a coin is created that makes transactions even easier and faster then it could overtake the current king. There are plenty of other of coins out there all vying for the #1 position that Bitcoin currently has locked up.
I’ve used Bitcoin before and it was extremely easy. The key for it will be to be able to be accepted in consumer transactions at stores. Whichever coin can accomplish this feat will be the king. Once a cryptocurrency can provide the almost instantaneous transaction that a credit card transaction can provide then look out! This post isn’t to go into the other cryptocurrencies but to simply see what we think the future holds for Bitcoin in this section.
Until Ethereum Litecoin, Dogecoin, Ripple, or any of the other alt-coins can overtake the king known as Bitcoin then it isn’t going anywhere. For the near to intermediate future Bitcoin will be around and plenty of transactions will be taking place.

What Not to Do When Investing in Cryptocurrencies
Whatever you do, do not do what these people did:
- https://money.cnn.com/2018/09/11/investing/bitcoin-crash-victim/index.html
- https://www.reddit.com/r/Bitcoin/comments/7mlso0/dont_repeat_my_mistakes_i_had_everything_now_i_am/
- https://business.financialpost.com/technology/blockchain/financially-ruined-cryptocurrency-investors-learn-hard-lessons-after-bitcoin-boom-busts
What was the common theme in most of those sad articles?
- They were over-leveraged
- They borrowed money
- They gave into their greed which caused them to make poor decisions
- They didn’t cash out and play with the houses money
- They treated speculation the same as an investment
Some of the people in the stories above made 2X the amount of money they put into it in a very short amount of time. They didn’t realize they were speculating and treated it as an investment. If they had then they should have taken out the money they put in and let the rest ride. Plus, some of them borrowed money in order to put as much in as possible. This creates a huge amount of pressure and blinds your judgement even more. If you read the articles you can see one bad decision after another.
I have a friend who started speculating with Bitcoin when it ran up to over $20,000. She had no idea what Bitcoin did or what it was but she had friends tell her she could make money easily by purchasing it. When she told me this she had already made 2-3 times what she had put in. I advised her to take out the money she had put in and she can let the rest ride.
When you give someone unsolicited advice they don’t appreciate it. I could tell she didn’t want to hear what I advised her to do because if Bitcoin goes up to over $100,000 then I will have costed her thousands of dollars.
Soon after we had this talk the Bitcoin futures were created and the price plunged to around $3,000. She never mentioned what she had done and if she had ever sold so I’m pretty sure she was in the red. Now that bitcoin is around $12,000 she is probably back in profits but who knows what she did with it over the last 2 years. I knew the top was very close once I had that conversation with her because when people start putting money into something they have no idea about then the market is getting ready to crash.
That is exactly what happened.
Usually when you blow an account you do so over a set of bad decisions, one after another. There is rarely only one bad decision that causes you to go bust. It is a series of bad decisions you make over and over again. They usually start out small and then get bigger and bigger over time. Then once you realized you really are in trouble it is too late.
This is typically how most accounts or lives that are ruined happen. They are a series of small mistakes that compound over time and you ignore the warning signs until it is too late.

Conclusion
In the very near term it looks like the price of Bitcoin will go up and hit $12,363. This will complete the Springboard long setup in the 4-hour chart.
If the price stays inside the parabolic curve (to the left of the parabolic curve) in the daily and weekly charts then the bull run is still in tact. But when the price closes below the parabolic curve then all bets are off. That is when the retracement will happen. So if you are currently in Bitcoin you should still be good. But please be careful when the price closes outside of the parabolic curve. If you are in profit and the line breaks then I would be very careful to protect your gains. This is just my opinion and should not be taken as financial advice.
I showed the retracement levels I look for Bitcoin to hit when the parabolic curve is broken as long as the current swing high of around $14,000 stays in tact.
I’ve already exited my positions when the price hit around $13,000 because it completed another setup previously.
Trading Bitcoin is just like trading any other market or instrument. Follow your trading plan. But in order to have a trading plan you first must find out what works for you. The way I discovered what works for me was through meditation. Here is the post on how I discovered what works for me through meditation. If you would like to see the exact process I use then check out this post: https://evancarthey.com/how-to-become-a-profitable-trader-using-meditation/.
I also wrote a post about the books that have helped me out the most with meditation and my psychology, you can read it here: https://evancarthey.com/best-meditation-books-for-traders/.
So for my Bitcoin Price Prediction for 2019 I think Bitcoin can remain in a bull market as long as it stays inside the parabolic curve. But if that is broken sometime in 2019 then look for the retracement levels at the 50% area to be hit and then after that look for the 78.6% level.
Take care,
Evan


