American Express is a company that thrives off of you being in debt. This post will be about American Express stock (AXP): Why Their Stock Keeps Going Higher. The more you buy on credit then the more interest you make from people being in debt. This post isn’t going to be about how they make their money, it is about the stock, their fundamentals, and what their technical setups look like.
American Express Stock (AXP): Why Their Stock Keeps Going Higher – Fundamentals
There are 7 fundamental markers I look for in a stock. I try to only purchase growth stocks so these are the parameters I look for to see if a stock meets the majority of the markers. I prefer to have all seven fulfilled. You can it more in-depth here: https://evancarthey.com/how-to-scan-for-winning-stocks-an-insiders-view-to-my-process/
- Market Cap: > $300 million
- EPS growth in past 5 years: >0%
- P/E: Over 10
- EPS growth next 5 years: >0%
- Sales growth past 5 years: Over 20%
- Debt/Equity: <0.1
- Sales growth qtr over qtr: Over 5%
Does the stock meet these 7 markers?
- Market Cap: 102.96B (YES)
- EPS growth past 5 years: 8.50% (YES)
- P/E: 16.99 (YES)
- EPS growth next 5 years: 9.10 (YES)
- Sales growth past 5 years: 4.50% (NO)
- Debt/Equity: 6.00 (NO)
- Sales growth qtr over qtr: 7.80% (YES)
I used Finviz.com for the fundamental analysis screener.
AXP does not hit all 7 of the growth markers so fundamentally this is not a growth stock. Although, since January 2019 it has looked like an amazing growth stock. American Express’s stock price has gone from $90 to around $125 in 6 months this year. Since people keep buying and getting themselves in debt this is probably a stock I would keep an eye on.
Technical Analysis for the American Express Stock
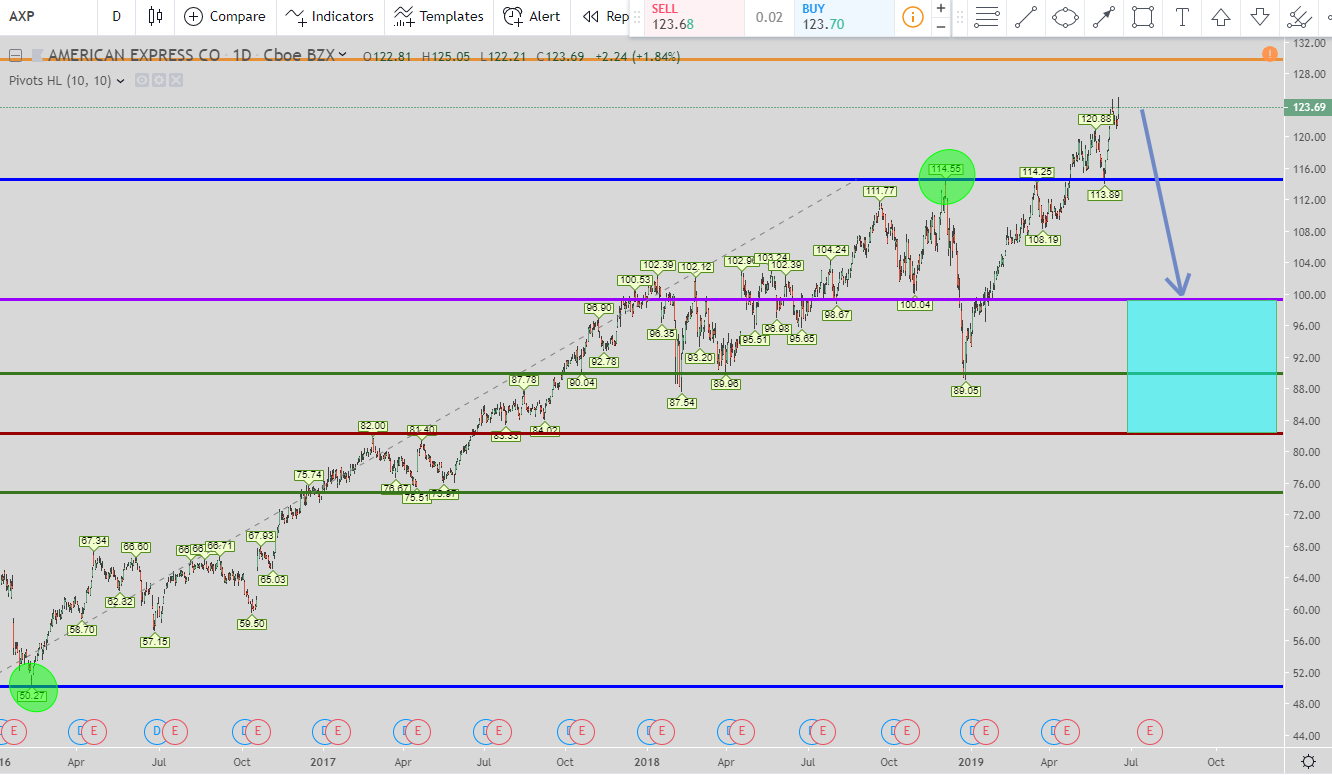
This setup is the Spring Board short setup. It is based upon the move missing the 123.6% Fibonacci extension level.
If the price moves up and hits the orange line at $129.70 then this setup is not valid. So to be clear, if price continues to move up and 1st hits the orange lineat around $129.70 then the move I will talk about here will not be valid.
If the price doesn’t hit the orange line but moves down and hits the purple line which is the 23.6% Fibonacci retracement level then this is a live trade. The exit will be the bottom of the teal box around $83.00.
But if the price moves back up after hitting the purple line and hits the blue line at $114.58 then you enter there as well and your exit moves to the green line at around $90.25. Finally, if the price continues to move up and hit the orange line at around $129.74 then you move the exit to the purple line at around $100. That is the final time the exit moves even if price continues to rise. You can continue to get in if the price moves higher.
There is an entry filter that I discovered that I will talk about below.
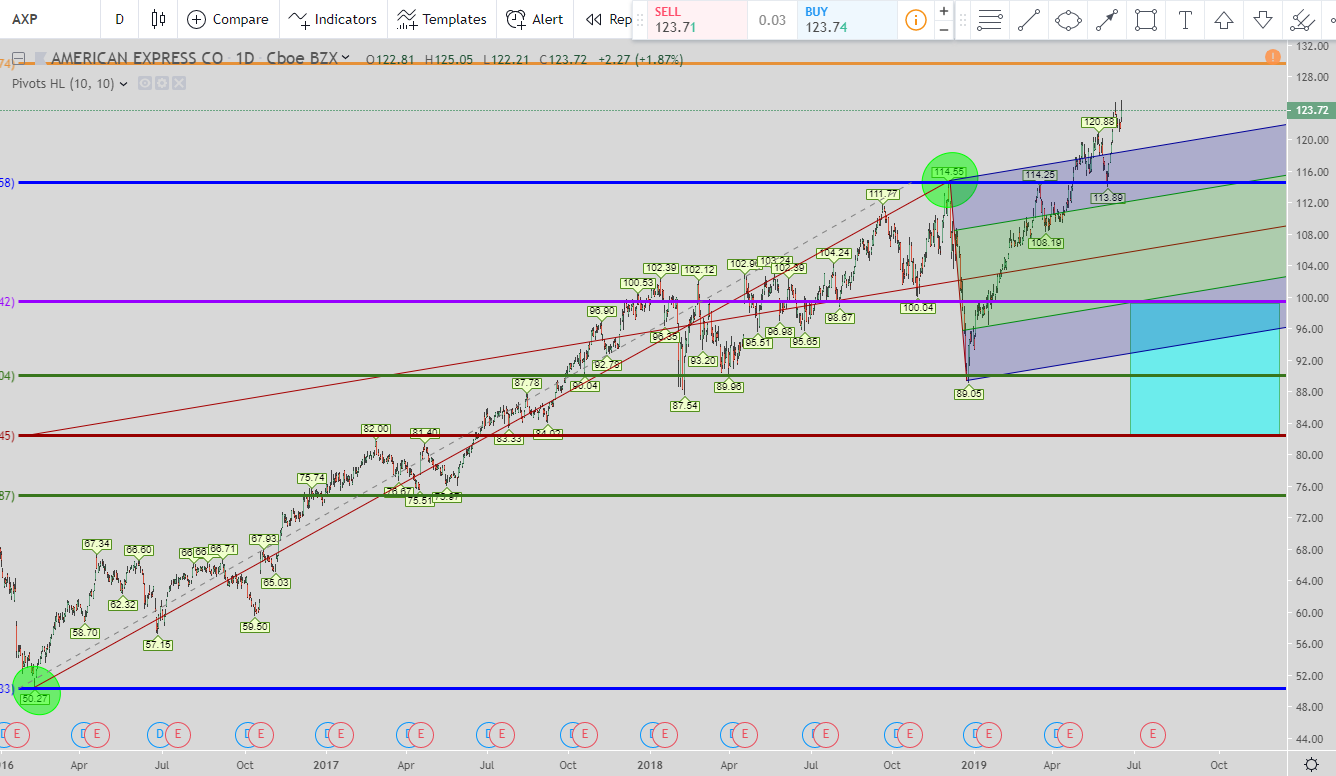
I’ve always been intrigued by Pitchfork’s and I have finally found a way to incorporate it into my trading. I’ve been meditating more so it comes as no surprise that this idea came to me.
The filter is using the Schiff Pitchfork, not Andrew’s Pitchfork. What we are waiting on is for the price to break below the red line which is the middle line in the Schiff Pitchfork (SP). Once that happens then you can get in short even if the purple line has not been hit. The same exits and apply to what I wrote about above.
But if the price moves up and hits the orange line first then this setup and entries are invalid.
Conclusion for American Express Stock (AXP): Why Their Stock Keeps Going Higher
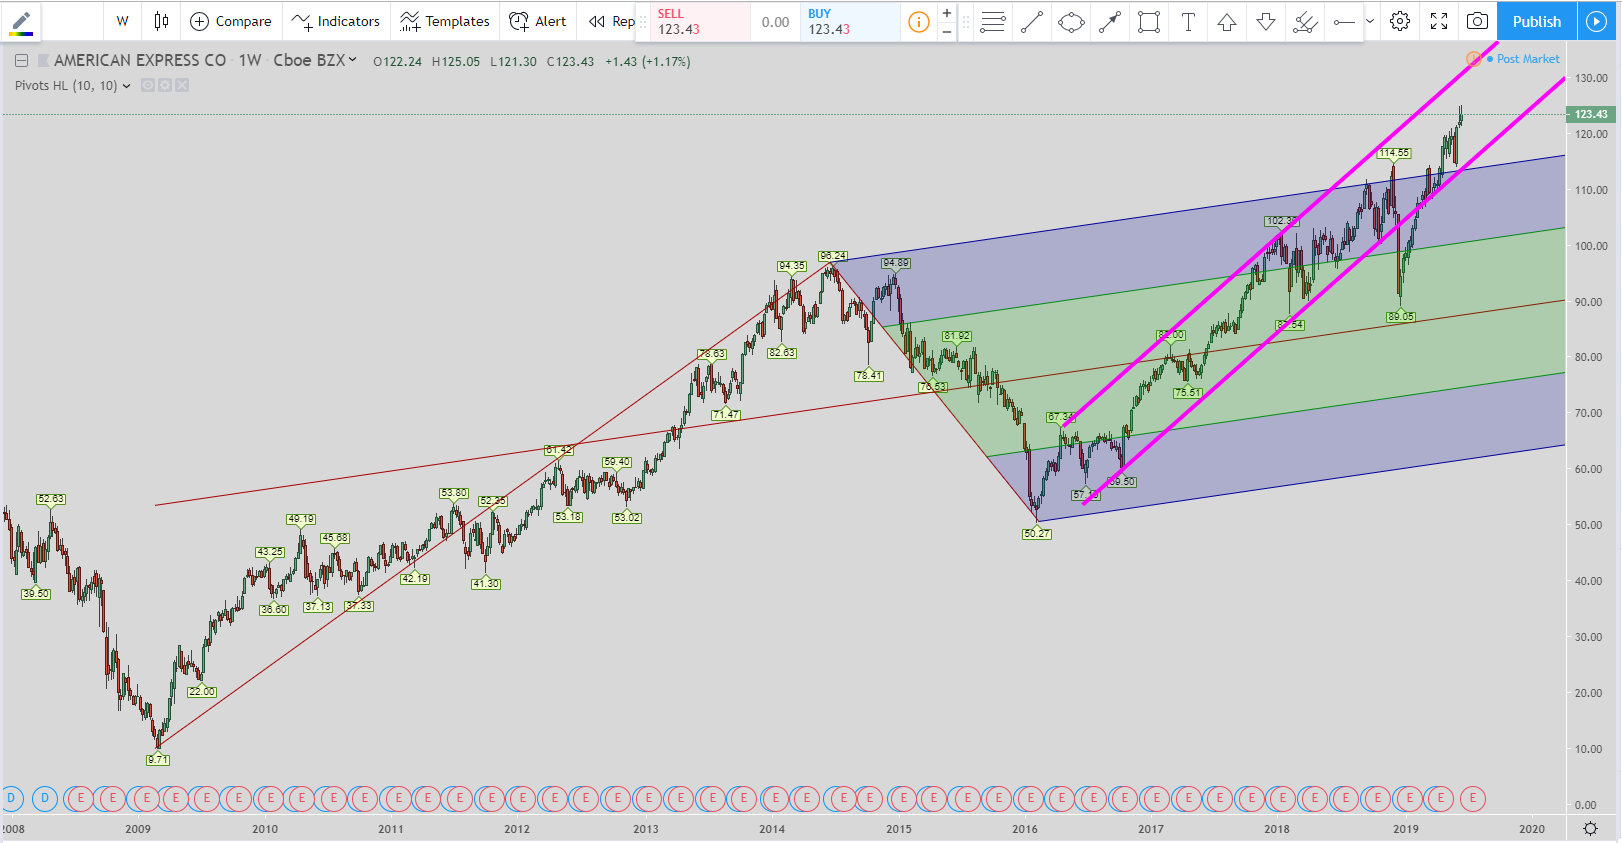
Overall you can see from the Weekly chart of AXP above that it is still in a very strong trend channel to the upside. It has even broken out of the long term Schiff Pitchfork to the upside. Until some short setups start appearing with volatility then all we can do is wait for more setups to appear. I’m not a break-out trader so I unfortunately cannot give setups to follow the trend which is obviously to the upside.
Popular Links
Here are a couple of links if you are looking at how I view the market and some trade setups. You can create your own trading style and setups. Quit paying losing traders to teach you. The only thing they teach is how to lose money.
Robinhood Trading Broker Review
If this post benefits you and if you haven’t used Robinhood for trading stocks but are thinking to then please consider using my referral link when you do sign up: http://share.robinhood.com/evanc203.
This way each of us will receive a free share of a random stock if you sign up through my referral link.
My Robinhood Review: https://evancarthey.com/review-robinhood-trading-service-with-no-fees-part-1/


