Today we are going to look at Alexandria Real Estate Equities (ARE) to see how high this stock can go. Since late December 2018, it has mimicked the S&P 500 which is a good thing.
The stock has gone from $110 to almost $145. We will look at the 7 fundamental parameters I look to see if a stock can be considered a growth stock.
Then we will take a look at the technical analysis side using the setups I have created and use for my trades. I have no plans to own Alexandria Real Estate Equities in the next 72 hours and do not hold any positions in ARE.
Alexandria Real Estate Equities (ARE): How High Can This Stock Go? – Fundamentals
There are 7 fundamental markers I look for in a stock. I try to only purchase growth stocks so these are the parameters I look for to see if a stock meets the majority of the markers. I prefer to have all seven fulfilled. You can it more in depth here: https://evancarthey.com/how-to-scan-for-winning-stocks-an-insiders-view-to-my-process/
- Market Cap: > $300 million
- EPS growth past 5 years: >0%
- P/E: Over 10
- EPS growth next 5 years: >0%
- Sales growth past 5 years: Over 20%
- Debt/Equity: <0.1
- Sales growth qtr over qtr: Over 5%
Does the stock meet these 7 markers?
- Market Cap: 15.90B (YES)
- EPS growth past 5 years: 17.30% (YES)
- P/E: 43.42 YES
- EPS growth next 5 years: 0.10% (YES)
- Sales growth past 5 years: 16.00% (NO)
- Debt/Equity: 0.78 (NO)
- Sales growth qtr over qtr: 12.10% (YES)
I used Finviz.com for the fundamental analysis screener. With Alexandria Real Estate Equities hitting only 5 of the 7 markers it is not a growth stock in my eyes and not one I would be interested in. Also, the EPS growth for the next 5 years barely beat the limit of greater than 0% with a 0.10%. Obviously, there are other factors at play that have catapulted this stock up from $110 to $140 in only 5 months. The last 4 calls by banks have all been upgrades dating back to December 2017.
Technical Analysis for Alexandria Real Estate Equities

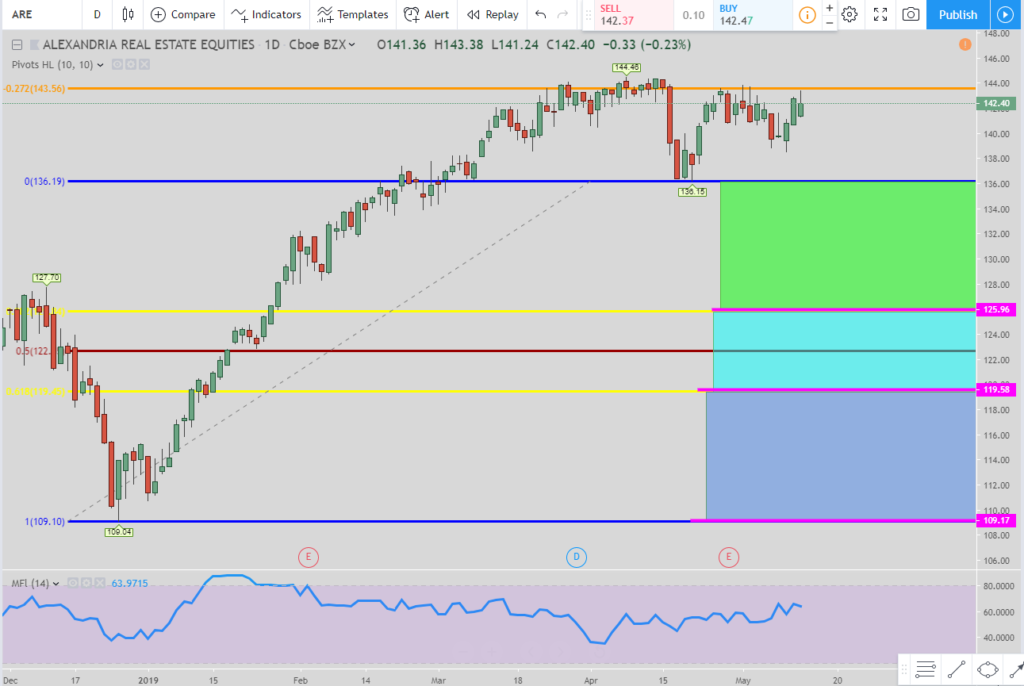
In looking at the daily chart we are waiting on two setups, the pic above is the first setup. It is the 61B long setup. The pink lines are the entries. The top of the colored boxes are the exits. So if the price hits the top pink line then the exit is the top of the green box. If it hits the 2nd pink line before hitting the top of the green box then the exit moves to the top of the teal box.
Finally, if the price hits the bottom pink line before hitting any of the previous exits then the exit moves to the top of the blue box. If at anytime any of the exits are fulfilled then the move is over, do not get in at any entries that have yet to be initiated.

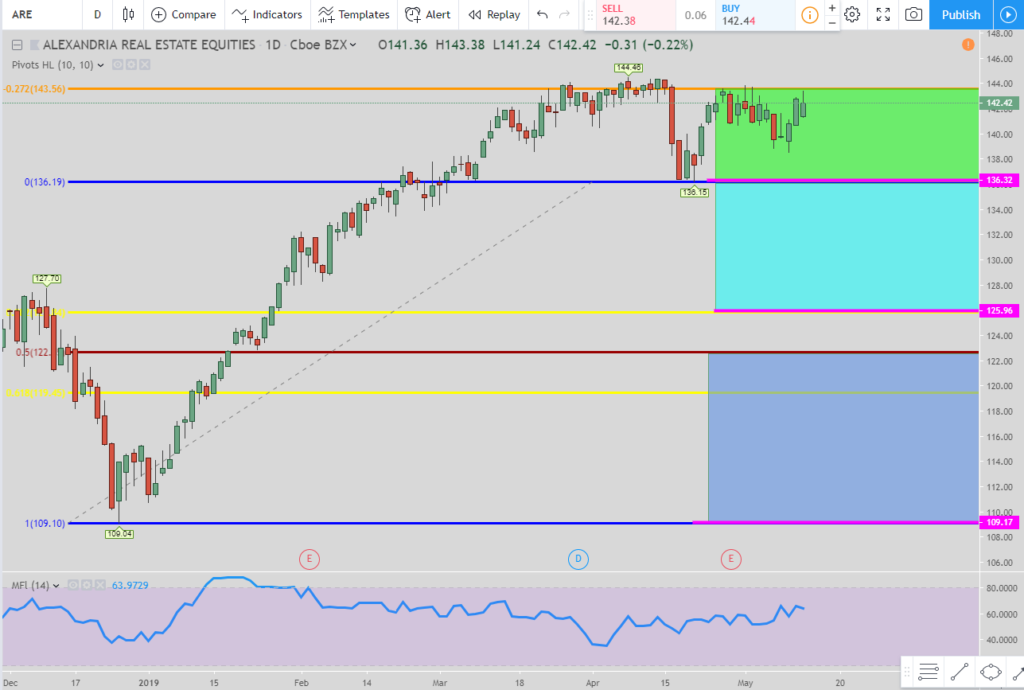
The second setup is the 127 long. Again the pink lines are the entries and the top of the colored boxes are the exits. Same rules apply. If an exit is hit then the rest of the entries become null and void. It will then be time to look for a new setup.
I try to provide a short setup as well with my stock reviews but there currently isn’t one based upon my setups. We will need to wait for a retracement to happen in order to provide the setups I require.
Popular Links
Here are a couple of links if you are looking at how I view the market and some trade setups. You can create your own trading style and setups. Quit paying losing traders to teach you. The only thing they teach is how to lose money.
Robinhood Trading Broker Review
If this post benefits you and if you haven’t used Robinhood for trading stocks but are thinking to then please consider using my referral link when you do sign up: http://share.robinhood.com/evanc203.
This way each of us will receive a free share of a random stock if you sign up through my referral link.
My Robinhood Review: https://evancarthey.com/review-robinhood-trading-service-with-no-fees-part-1/


